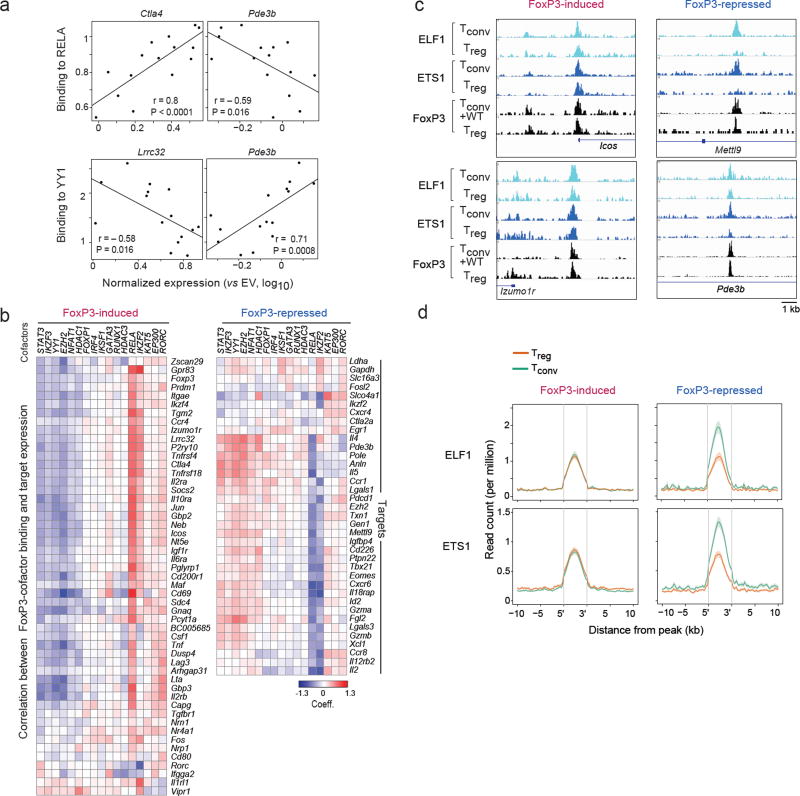
Fig. 5. Connecting cofactor interaction and transcriptional activity.
(a) Pearson correlation between FoxP3 mutants’ binding to RELA or YY1 (Y-axis) and their ability to induce expression of FoxP3-induced (Ctla4, Lrrc32) or –repressed (Pde3b) targets (X-axis, per Fig. 2b). (b) As in a, correlation between the mutants’ ability to activate each FoxP3-induced target and the ability to bind each cofactor; the heatmap shows the coefficient from linear model including DNA-binding as a covariate (hierarchically clustered, rows and columns). (c) Representative traces of ELF1 and ETS1 and FoxP3 binding at representative FoxP3-induced and –repressed signature loci. (d) Density of chromatin marks for ELF1 and ETS1 ChIPseq in a 10 kb window around FoxP3 binding sites for Treg -up or-down signature loci (data from 26).

