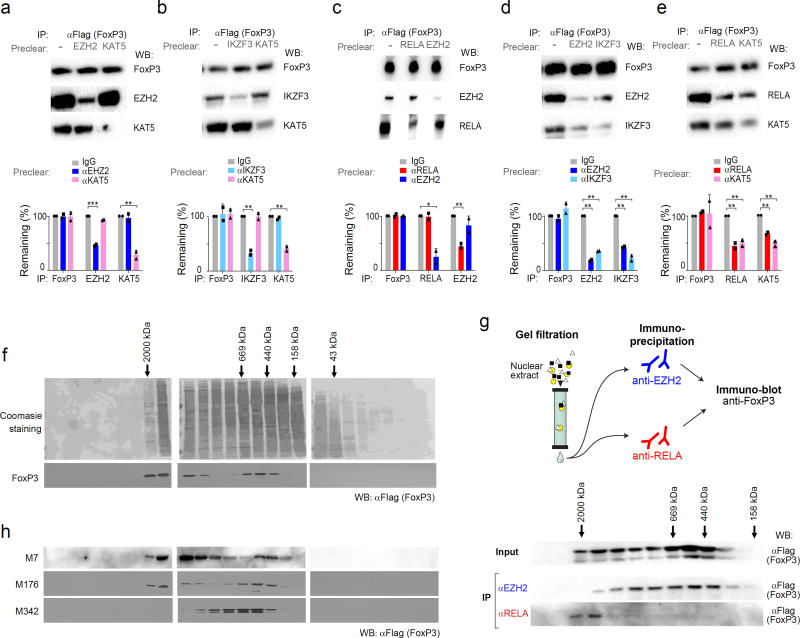
Fig. 6. FoxP3’s active and inactive cofactors form different complexes.
After co-transfection of wild-type FoxP3 with (a) EZH2 and KAT5 (aka TIP60); (b) RELA and EZH2; (c) IKZF3 and KAT5; (d) EZH2 and IKZF3; (e) RELA and KAT5, cell lysates were pre-cleared by capture with antibodies against indicated factors, before co-IP as in Fig. 4 (anti-FoxP3 IP, immunoblot with anti-cofactor as shown); blots representative of three independent experiments, combined in bar graphs below (Student’s t test p-value vs depletion by non-specific IgG; *: p< 0.05, ** < 0.005, *** < 0.001. (f) Gel filtration: Total cell lysate from FoxP3-transduced CD4+ T cells was fractionated by Superose 6 FPLC, and the fractions tested for FoxP3 content by PAGE immunoblotting; data representative of two independent experiments. (g) Gel filtration and co-IP: FPLC fractions from FoxP3-transduced CD4+ T cells were IPed with anti-RELA or -EZH2, and the co-precipitated FoxP3 detected by immunoblot; data representative of two independent experiments. (h) Total cell lysates from CD4+ T cells transduced with mutants (M7, M176 and M342) fractionated and probed as in f; data representative of biological replicates.

