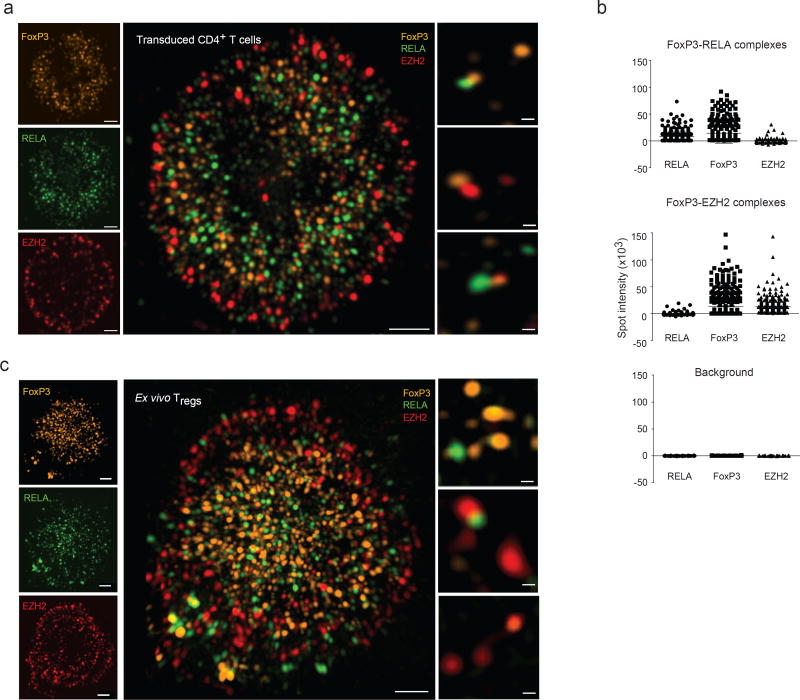
Fig. 7. Different FoxP3 molecular complexes distribute to different regions of the nucleus.
(a) FoxP3 was transduced into activated CD4+ T cells, and imaged with endogenous RELA and EZH2 by 3D-SIM. Left: overview of the nuclear distribution of the factors; center: higher magnification merge; right: representative co-localized microclusters, single z plane. Data representative of 50 cells in biological triplicates. (b) Co-localized spots containing FoxP3 and RELA (top), or FoxP3 and EZH2 (middle) were selected, and florescence intensity for three proteins measured in these voxels (bottom: background values outside the microclusters). Data combined from 5 independent experiments. (c) FoxP3, RELA and EZH2 were visualized in ex vivo Treg by 3D-SIM. Data representative of 30 cells in biological triplicates.

