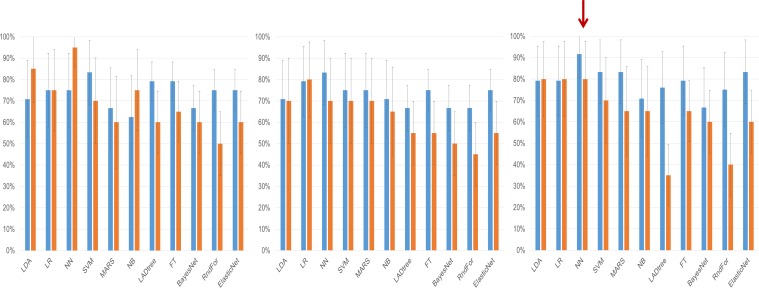
Figure 2. Clinical performance characteristics of the tested models.
Sensitivity (blue bars) and specificity (orange bars) of the classifiers on the testing set depending on the method of variable selection. Whiskers denote 95% Confidence Intervals. (a) – Performance of models created on the subset of miRNAs selected using the significance-based filter. (b) Performance of models created on variables selected using the CFS subset algorithm. (c) Performance of models created using variables selected by the fold change-based filter. The red arrow denotes the model with the best performance characteristics, the neural network analysis using the fold change-based filter variable.

