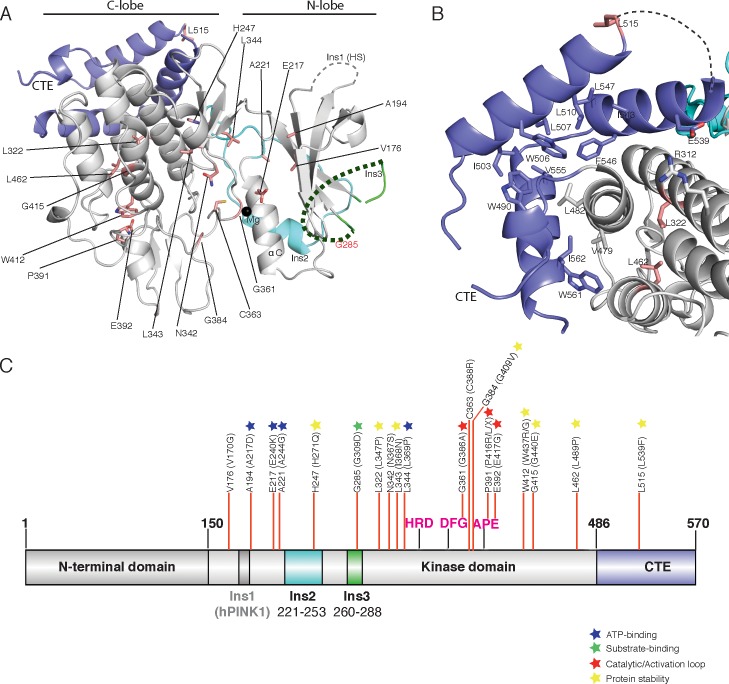
Figure 5. Spatial map of Parkinson’s disease (PD) linked mutations within hPINK1.
(A) Mapping of PD mutations onto the TcPINK1 structure (coloured as in Figure 1B). Pathogenic hPINK1 disease mutant residues are shown in red sticks; disease mutants in the disordered region (represented by dashed line) of Ins3 are labelled in red characters. (B) Interface of the CTE and C-lobe of TcPINK1 showing the hydrophobic core (shown in grey or blue) of the TcPINK1 kinase domain. hPINK1 PD mutations in the vicinity of the hydrophobic core are shown in red sticks. (C) Location of hPINK1 PD mutations (marked with red lines) on the primary TcPINK1 sequence. hPINK1 mutations are shown in parenthesis.

