. 2017 Nov 9;6:e31126. doi: 10.7554/eLife.31126

Figure 6. Differences in RNA quality between dementia and controls greatly impact gene expression results.

(A) Gene expression differences between donors with and without dementia in uncorrected data. Histograms show the distribution of log2(fold difference) expression levels (x-axis) between control and dementia donors in two brain regions (hippocampus, left; temporal cortex, right). Numbers indicate how many genes have a fold change > 1.3 (red lines) and p<0.05. (B) RNA quality in donors with dementia (Dem.; right bars) is significantly lower than in non-demented controls (CT; left bars) in all four brain regions. Y-axes are RIN values. Plots as in Figure 2B–D. (C) Gene expression levels for many genes are highly correlated with RIN, with more showing lower expression with lower RNA quality (positive values) than with higher RNA quality (negative values). Histograms show the distribution of RIN correlations in two brain regions. Numbers indicate how many genes have R > 0.5 (red lines) and p<0.05. (D) Rank order of fold differences between controls and dementia cases is largely unchanged after controlling for RNA quality. Ranked fold differences on the x- and y-axes correspond to Figure 6A and Figure 5A, respectively. Dots indicate genes and are color-coded by density. (E) Genes with higher or lower expression levels in people with dementia compared with cognitively normal older adults from 12 brain regions in eight previous studies (rows) are related to dementia diagnosis and RNA quality in this study. Horizontal tics show the 25th percentile, median, and 75th percentile rank of the indicated dementia-related list in our current data set. Gene expression levels from genes lower in low RIN samples are also lower in AD samples from the comparison studies (red, solid lines are shifted towards 1), while gene expression levels from genes higher in high RIN samples are also higher in AD samples from the comparison studies (red, dotted lines are shifted towards 0). Gene expression results accounting for RIN (green) generally agree less well between studies than results not accounting for RIN (blue). See also Figure 6—figure supplements 12 and Figure 6—source datas 16.

Figure 6—source data 1. Log2 fold changes between AD vs. control and dementia vs. control for each gene in all four brain regions, along with associated SVA p-values.
Results for both RIN corrected and uncorrected data are shown.
DOI: 10.7554/eLife.31126.023
Figure 6—source data 2. Correlations between each gene and RNA quality (RIN) with associated SVA p-values in all four brain regions.
DOI: 10.7554/eLife.31126.024
Figure 6—source data 3. Significant GO terms for genes increasing or decreasing expression with decreasing RNA quality.
Up to 50 significant categories for molecular function (MF), cellular component (CC), and biological process (BP) are shown, after correction for multiple comparisons.
DOI: 10.7554/eLife.31126.025
Figure 6—source data 4. Description of nine previous studies comparing AD vs. control, including details of how gene lists used in paper were derived.
DOI: 10.7554/eLife.31126.026
Figure 6—source data 5. List of 26 gene lists from the nine above publications that are used in Figure 6E.
elife-31126-fig6-data5.xlsx (341.9KB, xlsx)
DOI: 10.7554/eLife.31126.027
Figure 6—source data 6. Significance of association between each of the first 25 principal components and every assessed metric in the un-normalized and RIN-normalized data.
SVA P-values (Bonferroni corrected) are shown. Only metrics with at least one significant association in any region in either the un-normalized or RIN-normalized data are included in the table.
DOI: 10.7554/eLife.31126.028

Figure 6.

Figure 6—figure supplement 1. Differences in RNA quality between AD and controls greatly impact gene expression results.

Figure 6—figure supplement 1.

See legend for Figure 6 - all panels are matched, but only when considering the subset of dementia donors with AD diagnosis. Panel C is identical to Figure 6C and reproduced for continuity.
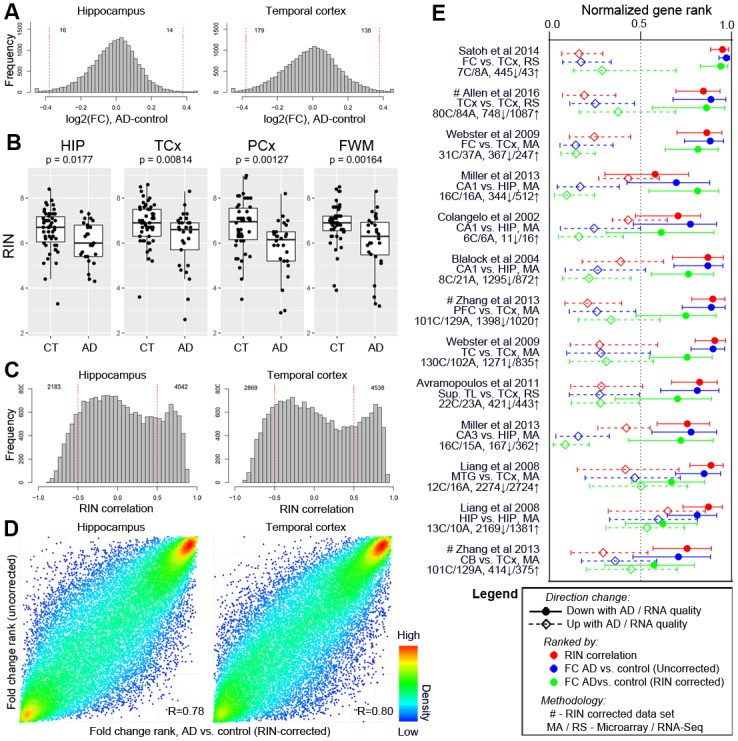
Figure 6—figure supplement 2. Decreased separation of brain region in principal component space without RIN correction.

Figure 6—figure supplement 2.

(Left) Principal component analysis (PCA) of all samples in this data set using RIN-corrected data separates cortical grey vs. white matter (PC 1, x-axis) and hippocampus from cortex (PC 2, y-axis). First two PCs are shown and explain 43.8% of the variation. PCA groups samples by brain region (color), except for temporal and parietal grey matter, which completely overlap. (Center) Repeating the PCA on unnormalized data identifies one component related to brain region (PC 1) and a second component related to RNA quality (PC 2). Dots correspond to samples. Colors correspond to brain regions. (Right) Same plot as the center, but coloring each dot by RIN (white = low RIN, red = high RIN). *Included as separate files.