
Figure 2.
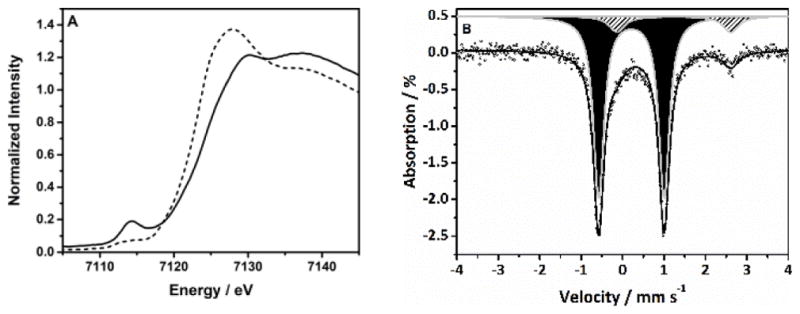
A) Normalized Fe K-edge X-ray absorption spectra of 1 (solid line) and 2 (dashed line) in a CH3CH2CN/CH2Cl2 solvent mixture (10% CH2Cl2 by volume); B) The zero field Mössbauer spectrum of 1 recorded at 4.2 K. The solid line is the simulation of the experimental spectrum (black dots) representing >95% of the absorption. The major component (90%; black shaded area) corresponds to 1; the minor component (10 %; gray shaded area) corresponds to unreacted 2.