
Figure 4.
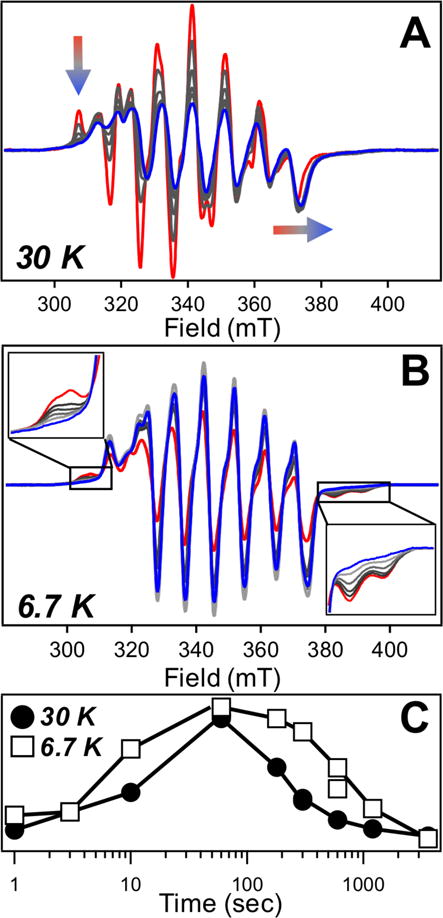
EPR-active intermediates monitored from 1 min (red) – 60 min (blue). (A) Narrow I1 species measured at high temperatures. Transient features indicated on figure. (B) Broad I2 species seen at low temperature with transient features magnified. (C) Scaled kinetic profile of intermediates.