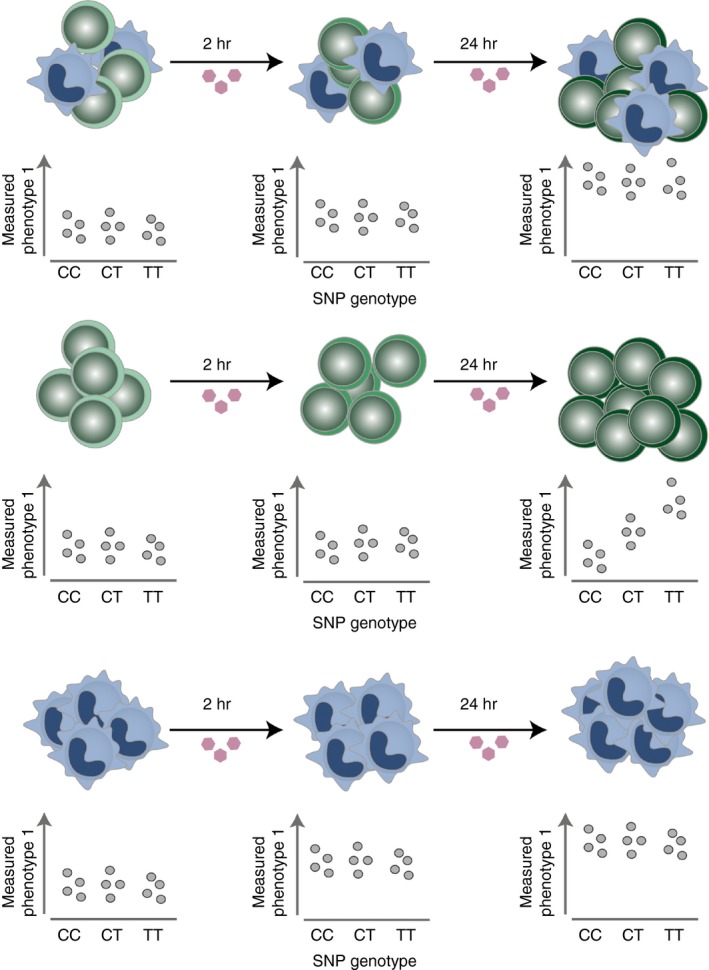
Figure 2.

Cell‐type‐specific and cell‐state‐specific expression quantitative trait loci. Cellular phenotypes, such as gene expression, cytokine secretion or chromatin accessibility, might be affected by a genetic variant only in a specific cell type and under specific conditions, e.g. at a specific time‐point following a stimulation. Here, a bulk of cell types (upper panel), as well as each cell type individually, were stimulated for 2 and 24 hr. In all scenarios, the measured phenotype, e.g. gene expression, increased upon stimulation, but only in the green cell type (middle panel) was the effect correlated with the genotypes. The effect was missed when measured in the sample containing the mixed cell population (upper panel). The blue cell type (bottom panel) expresses the strongest up‐regulation in expression upon stimulation and largely drives the observed increase in expression in the bulk sample.
