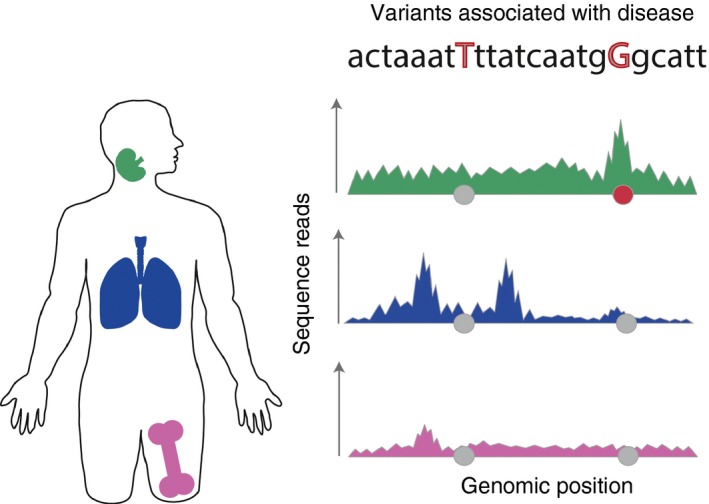
Figure 3.

Causal disease variants overlap cell‐type‐specific chromatin marks. Chromatin immunoprecipitation followed by sequencing and chromatin accessibility assays produce pile ups of reads that form ‘peaks’. Such genomic annotations generated from different tissues [lymph nodes (green), lungs (blue), femur (pink)] provide a valuable roadmap of cell‐type‐specific genome activity. The genome annotations can be overlapped with genetic variants associated with a phenotype of interest, such as an autoimmune disease, represented as grey circles. If a statistically significant proportion of associated variants overlaps with peaks specific to a cell type it can point towards disease‐relevant tissue and prioritize the causal variants. Here, we illustrate a single‐associated locus where only one single nucleotide polymorphism (red circle) overlaps with a peak specific to the lymph nodes and absent from the other two tissues.
