
Figure 3.
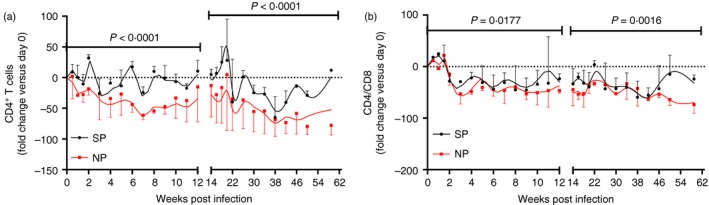
Fold changes of peripheral CD4+ T‐cell count and CD4 : CD8 ratio between normal progressor (NP) and slow progressor (SP) northern pig‐tailed macaques (NPMs). Longitudinal analysis of fold changes of (a) peripheral CD4+ T‐cell count and (b) CD4 : CD8 ratio. Fold change of day . Data are shown as median and error. The infection was divided into acute phase and chronic phase at 12 weeks post infection. Two‐way analysis of variance compared the fold changes of peripheral CD4+ T‐cell count and CD4 : CD8 ratio between normal and slow progressor NPMs. P < 0·05 was considered as statistically significant. [Colour figure can be viewed at wileyonlinelibrary.com]