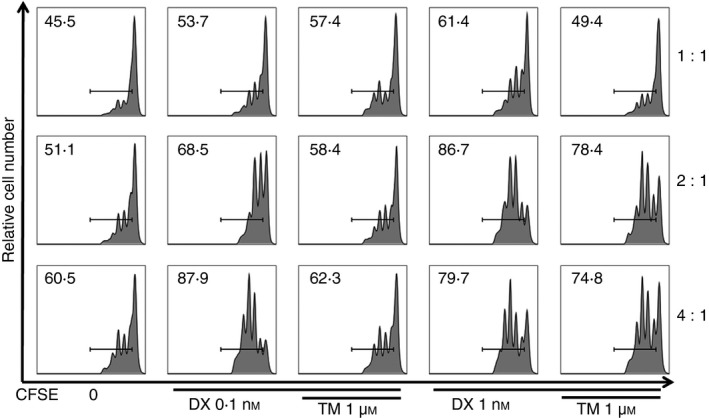
Figure 3.

Histogram plots of CFSE intensity indicating suppressive function of regulatory T (Treg) cells on effector T (Teff) cells. Treg cells stimulated by thalidomide (TM)/dexamethasone (DX) showed more potent suppressive effects than those given DX‐only treatment. The numbers on the histogram indicate percentages of proliferating cells among total T cells. The results shown are representative plots selected from five independent experiments.
