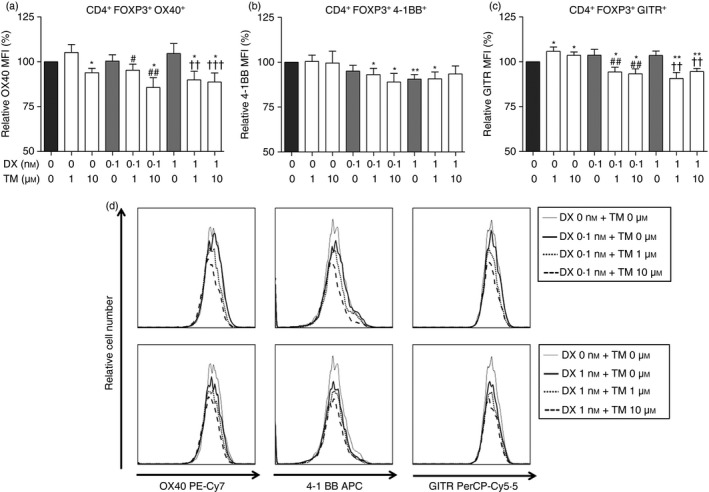
Figure 5.

Tumour necrosis factor receptor superfamily expression on differentiated CD4+ FOXP3+ T cells (Treg cells) induced by thalidomide (TM), dexamethasone (DX), or TM/DX combinatorial treatment. (a) OX40 (CD134; TNFSF4), (b) 4‐1BB (CD137; TNFSF9), (c) GITR (CD357; TNFSF18). (d) Histogram plots showing changes in expression levels of each molecule upon drug treatment. Changes in protein expression were analysed by FACS using relative MFI (% of non‐treated controls, n = 5). *P < 0·05 and **P < 0·01 compared with untreated controls; # P < 0·05 and ## P < 0·01 compared with 0·1 nm DX treatment; and †† P < 0·01 and ††† P < 0·001 compared with 1 nm DX treatment.
