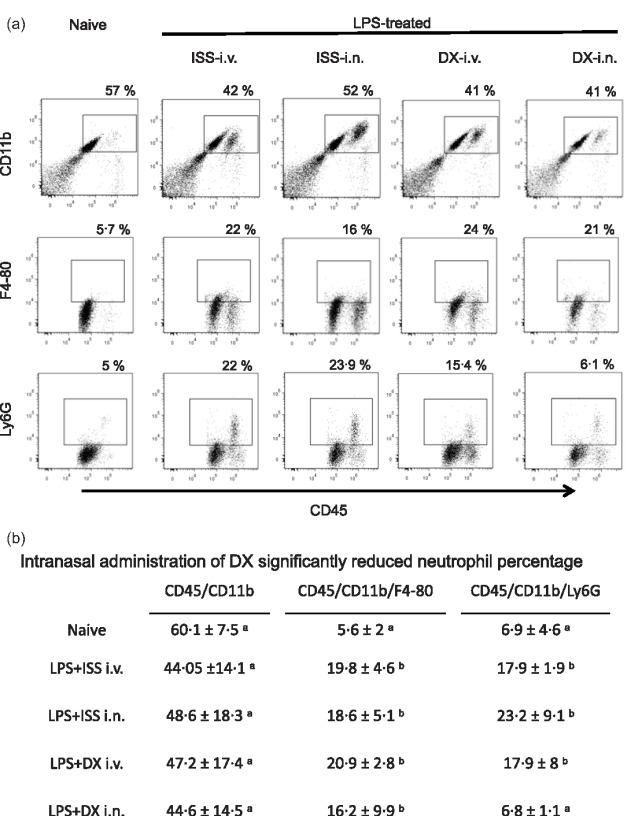
Figure 5.

(a) Representative dot‐plots of isolated brain cells from naive and lipopolysaccharide (LPS)‐treated mice that received saline or dexamethasone (DX), stained with anti‐CD11b, CD45 and F4/80 antibodies, and analysed by flow cytometry. (b) Mean ± standard deviation of the percentage of cells before and 48 h after LPS‐treated mice without additional treatment and 24 h after saline or DX treatment. The effects of the different treatment in each cell phenotype were compared. Data labelled with the same letter are not significantly different from each other, whereas those with different letters are significantly different.
