
Figure 1. Diagram for two simple models.
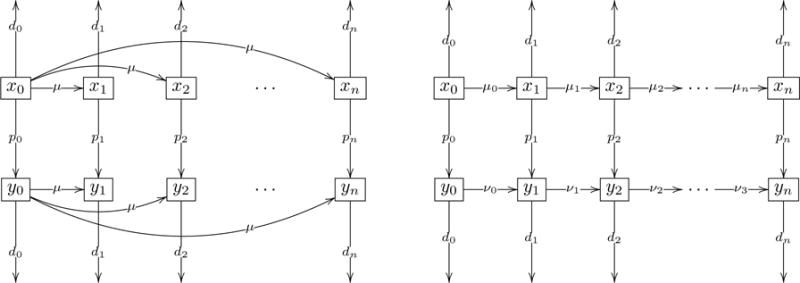
Variables xi, 0 ≤ i ≤ n represent non-cancerous populations and yi, 0 ≤ i ≤ n represent the cancer populations. The index indicates the level of instability. Parameters di represent death rates of populations xi and yi, parameters pi represent instability induced mutation rates, μ, μi, 0 ≤ i ≤ n and νi, 0, ≤ i ≤ n represent mutations generating the unstable types. (a) Radial mutation network model. (b) Sequential mutation network model.