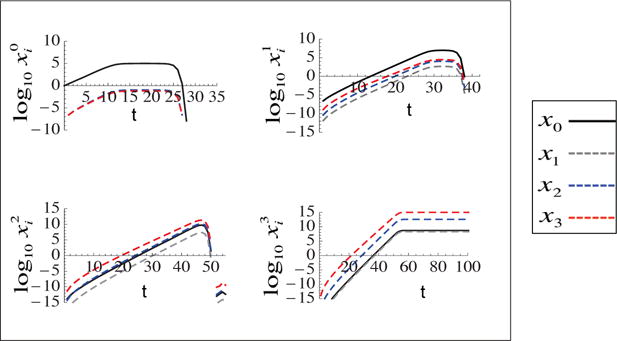
Figure 8. Temporal dynamics of different sub-populations with multiple driver mutations.

Radial mutation network with logistic growth equations. Each plot corresponds to a single step in carcinogenesis and plots the subpopulations at different instability levels. m = 3, n = 3, d0 = 10−4, d1 = 10−4, d0 = 10−3, d2 = 10−2, d3 = 10−1, p0 = 10−7, p1 = 10−5, p2 = 10−3.5, p3 = 10−2, , , , , a0 = 1, a1 = 1.05, a2 = 1.1, a3 = 1.15, a4 = 1.2.
