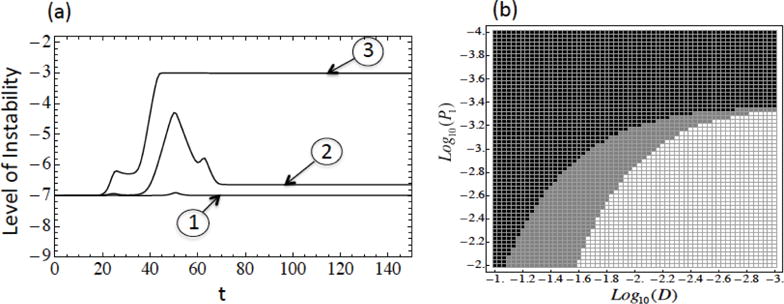
Figure 9. The dynamics of the instability in the presence of back mutations.

(a) Radial mutation network with multiple driver mutations. ➀, ➁, ➂ correspond to the three cases in section 3.1. n = 3, m = 6, , , , , ai = 1 + 0.05i, 0 ≤ i ≤ 6, μ = 10−7, p0 = 10−7, p1 = 10−5, p2 = 10−3, p3 = 10−2, d0 = 10−4, d1 = 10−0.5, 10−1, 10−2, d2 = 10−0.3, 10−0.4, 10−1, d3 = 10−0.1, 10−0.27, 10−0.2, for cases ➀, ➁, ➂ respectively. (b) Level of instability depending on the parameters D and p1 for radial mutation network model with a single driver mutation. Black corresponds to low levels of instability at all times, white to high level of instability at all times, and gray to high level of instability at first then switching to stability. The parameters are d0 = 10−4, p0 = 10−7, a = 1.2, μ = 10−7, n = 1.
