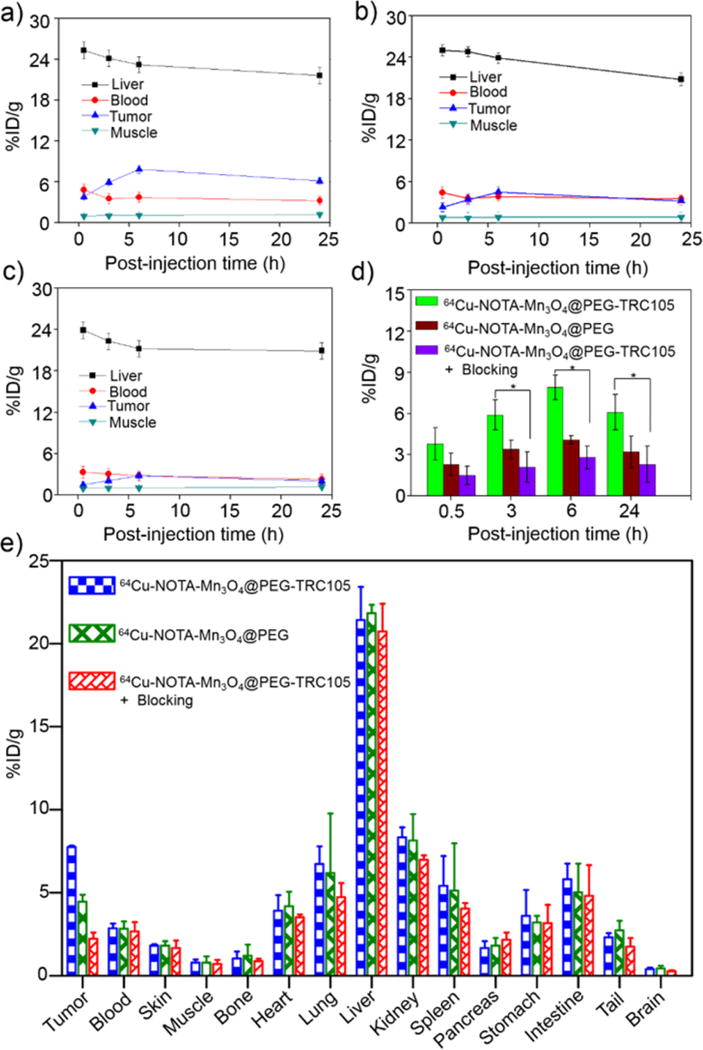
Figure 5.

Quantitative analysis of the PET data. Time-activity curves of the liver, 4T1 tumor, blood, and muscle following intravenous injection of (a) 64Cu-NOTA-Mn3O4@PEG-TRC105, (b) non-targeted 64Cu-NOTA-Mn3O4@PEG, and (c) 64Cu-NOTA-Mn3O4@PEG-TRC105, after a blocking dose of TRC105; (d) 4T1 tumor uptake in the three groups. The differences between uptake in 4T1 tumors of 64Cu-NOTA-Mn3O4@PEG-TRC105 and the two control groups were statistically significant (p < 0.05) at all time points, except at 0.5 h post-injection between 64Cu-NOTA-Mn3O4@PEG-TRC105 and 64Cu-NOTA-Mn3O4@PEG (n=3 per group); (e) Biodistribution studies in 4T1 tumor-bearing mice at 24 h post-injection of 64Cu-NOTA-Mn3O4@PEG-TRC105, 64Cu-NOTA-Mn3O4@PEG and 64Cu-NOTA-Mn3O4@PEG-TRC105, after a blocking dose of TRC105 (n=3 per group).
