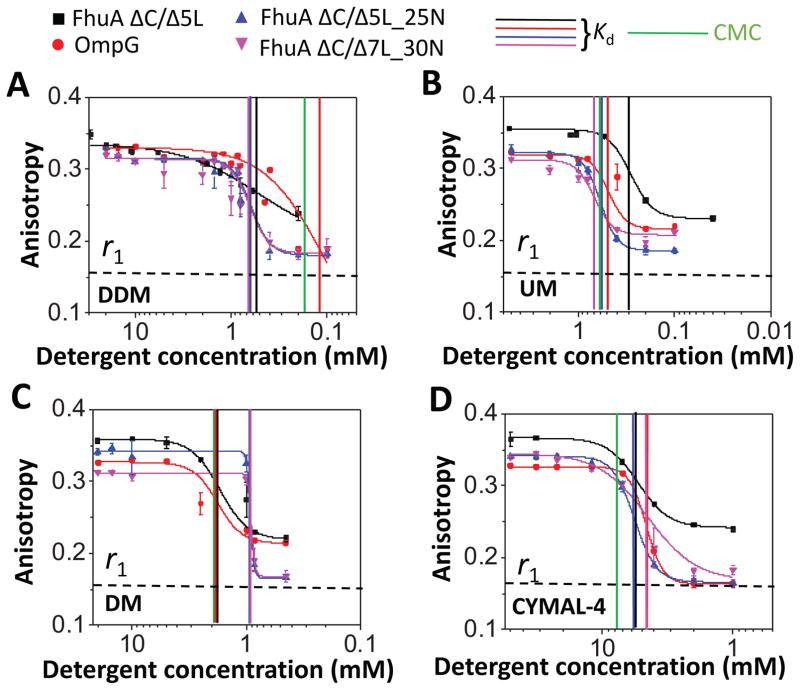
Figure 3. Dose-response changes in fluorescence anisotropy for neutral maltoside-containing detergents.
(A) n-dodecyl-β-D-maltoside (DDM); (B) n-undecyl-β-D-maltoside (UM); (C) n-Decyl-β-D-maltoside (DM); (D) 4-Cyclohexyl-1-butyl-β-D-maltoside (CYMAL-4). All anisotropy measurements were conducted out in 200 mM NaCl, 50 mM HEPES, pH 7.4, and at room temperature. The anisotropy data were recorded by adding overnight detergent-refolded protein to a bath of varying detergent concentration, but keeping the final protein concentration at 28 nM. Starting detergent concentrations were above the CMC. Thereafter, they were reduced at concentrations below the CMC (Experimental Methods). Time-dependent anisotropy measurements were conducted directly after dilution of the refolded protein sample at respective detergent concentration. Vertical bars represent the magnitudes of the CMC and Kd of the PDCs of varying isoelectric point of the proteins. The horizontal dashed bar represents the minimum anisotropy value, r1 = ~0.16, obtained with FhuA ΔC/5L in 6 M Gdm-HCl (Table 3). This anisotropy value corresponds to the most rotationally diffusive FhuA ΔC/Δ5L.

