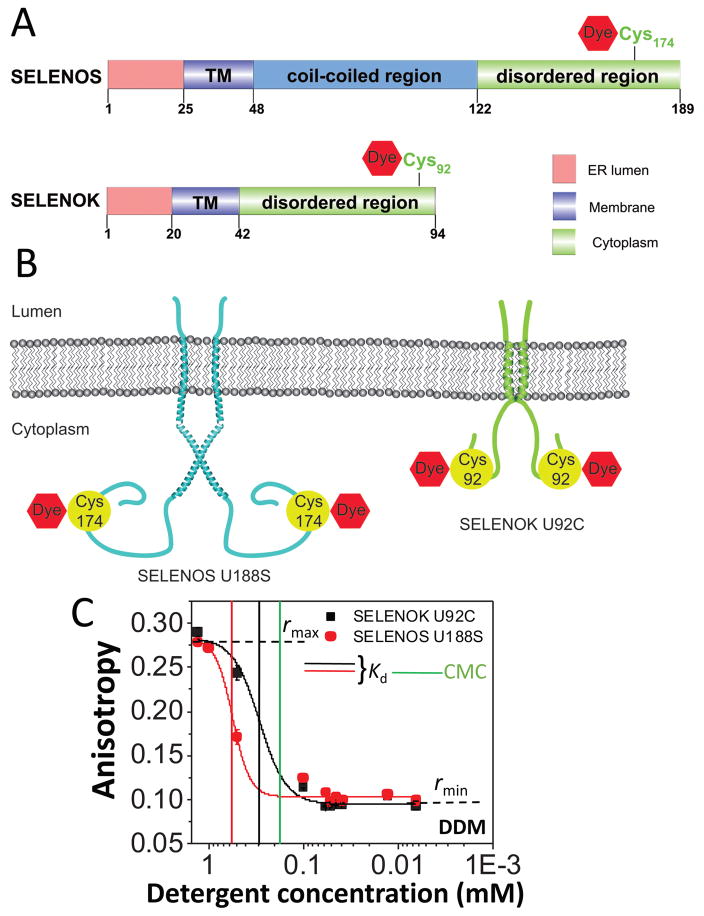
Figure 7. Dose-response in fluorescence anisotropy acquired with SELENOK U92C and SELENOS U188S, two short single α-helical transmembrane proteins solubilized in DDM.
(A) Cartoon presenting the transmembrane topography of the SELENOK U92C and SELENOS U188S proteins; (B) Domain organization and the position of relevant Cys and Sec residues of SELENOS and SELENOK. TM stands for the transmembrane region of these proteins; (C) The protein concentration in the well was 200 nM. The initial DDM concentration was 1.3 mM. The FP measurements were carried out using a solution that contained 200 mM NaCl, 50 mM HEPES, pH 7.4 at a temperature of 24°C. Vertical bars represent the magnitudes of the CMC and Kd. All the other experimental conditions were the same as in Fig. 3.

