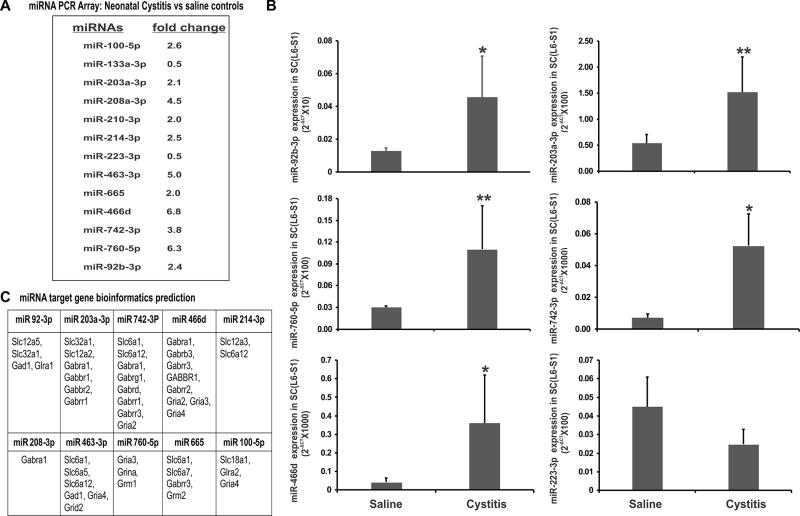
Figure 2.
miRNA expression profile and bioinformatics prediction of miRNA targets. (A) Qiagen PCR miRNA array (Neuropathic and inflammatory pain pathways) analysis of lumbosacral (L6-S1) spinal dorsal horn samples following neonatal zymosan-induced cystitis in rats. (B) Real-time RT-PCR validation of PCR array results for the differentially expressed miRNAs. The ordinate value 2−ΔCT corresponds to the miRNA expression relative to endogenous SNORD-95 expression and is represented as mean ± SD, n=5/group, * p<0.05, ** p<0.01 vs saline controls. (C) Target prediction of several GABA-associated genes with 3’UTR binding sites for miRNAs that show upregulation in cystitis rats (≥2 fold) compared to saline-treated controls.

