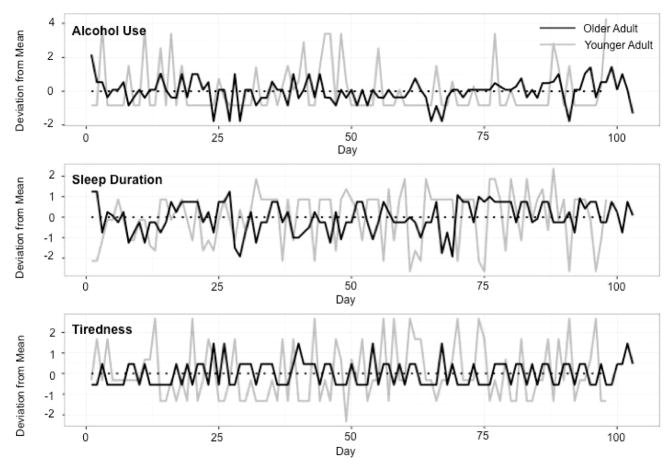
Figure 2.
An illustration of the trivariate, intensive-repeated data for a younger adult (gray continuous line) and an older adult (black continuous line). The continuous lines indicate changes in alcohol use (top panel), sleep duration (middle panel), and next-day tiredness (bottom panel) across days along the x-axis, relative to each participant’s person-specific, time-invariant means that are indicated by the dotted lines at zero along the y-axis.

