Figure 1.
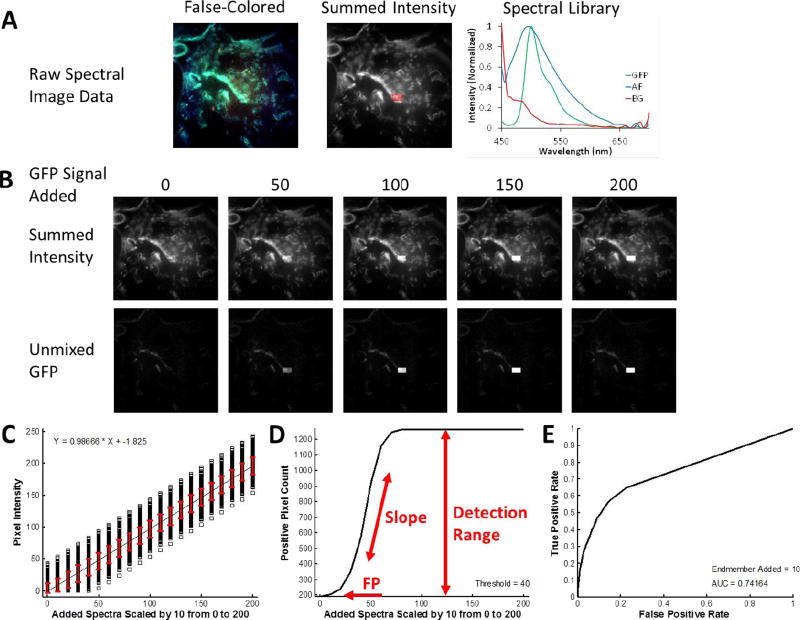
Overview of the Theoretical Sensitivity Curve procedure for determining the sensitivity of detecting a single endmember of interest. A) A raw spectral image that contains all endmembers except for the endmember of interest is acquired. For this example, a lung tissue slice that did not contain GFP-expressing cells (e.g., from a control animal) was imaged using the AOTF-based microscope system described in the Methods (instrument configuration #1). Spectral image data were acquired sequentially from 450–700 nm, in 5 nm increments. The false-colored image (left) displays the 610 nm (Red), 515 nm (Green), and 480 nm (Blue) bands as an RGB composite image. To visualize total fluorescence emission intensity, all wavelength bands are summed and a region of interest (ROI) is selected, as outlined shown in red. The spectral library used for analysis is also shown – in this case containing fluorescence emission spectra for green fluorescent protein (GFP), lung tissue autofluorescence (AF), and nonspecific instrument background (BG). These spectra were measured from single-label control samples: unlabeled lung tissue, GFP-expressing cells grown on coverslip, and a blank slide, respectively. B) The spectrum of the endmember of interest – in this case GFP – is added to the ROI in varying levels, where the number for GFP Signal Added indicates the intensity of the peak wavelength. The effect of adding the endmember signal can be visualized in the summed intensity image (the summed intensity across all wavelength bands) and in the spectrally analyzed image – in this case as analyzed using non-negatively constrained linear unmixing. C) The output of the theoretical sensitivity analysis methodology consists of 3 plots: the Theoretical Sensitivity Curve (TSC), the Thresholded Positive Pixel Curve (TPPC), and the Receiver Operator Characteristic Curve (ROC). These plots allow the user to assess the performance of the spectral imaging assay – including the sample characteristics, hardware configuration, and spectral analysis algorithm. The TSC is used to assess the linearity of response and to visualize the standard deviation of the analyzed (in this case, unmixed) spectral data. The TSC is generated by plotting the intensity of each pixel within the ROI after performing spectral analysis, for each amount of endmember signal added. Pixel intensities are shown as black squares, a linear regression to all pixel intensities is shown as a black line, and the red error bars indicate the standard deviation of pixel intensities. D) The TPPC is used to calculate the false positive detection rate at a given detection threshold, as well as to visualize the detection response slope (more vertical indicates increased ability to discriminate negative and positive pixels) and the detection range (which should equal the number of pixels within the detection region for a sufficiently high level of target endmember). The TPPC is generated by selecting a threshold for classifying positive pixels – in this case GFP-containing pixels. The number of pixels within the ROI above the threshold are counted and plotted as a function of endmember signal added. The ROC is used as an overall characterization of detection performance, where an area under the curve (AUC) of 1 represents an ideal discrimination between all positive and negative pixels. The ROC is also generated by assuming that any positive pixels detected within the ROI are true positive and that any positive pixels detected outside the ROI are false positive.

