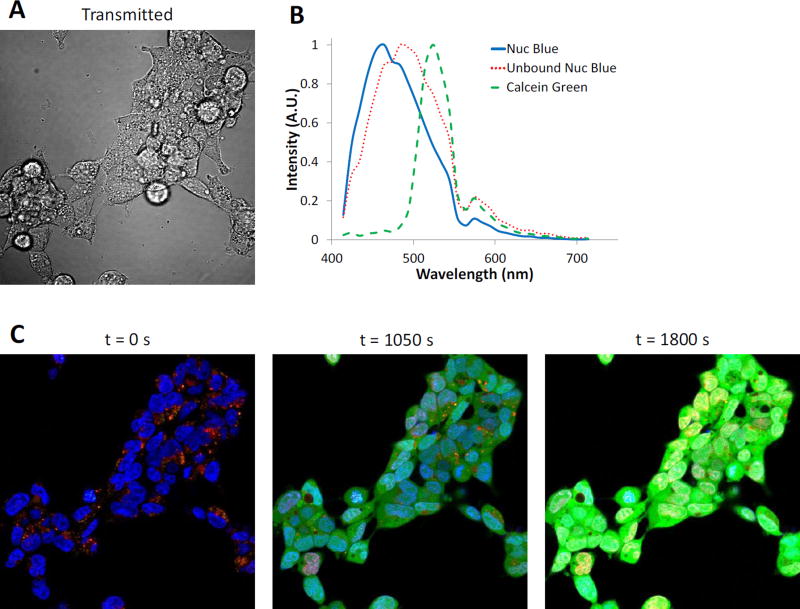
Figure 2.
Experimental validation of the theoretical sensitivity analysis methodology was performed by measuring Calcein Green uptake in HEK293 cells labeled with NucBlue (nuclear marker) using a Nikon A1R spectral confocal microscope. A) Transmitted light image to visualize cellular outlines. B) Spectral library used for linear unmixing. C) Merged, false-colored composite of unmixed images for 3 selected time points: 0, 1050, and 1800 seconds. NucBlue labeling is shown as blue, non-specific NucBlue labeling as red, and Calcein Green as green. Note that by the final time point, several nuclear regions exhibit a bright yellow color, indicating pixels that are oversaturated on at least one wavelength band.

