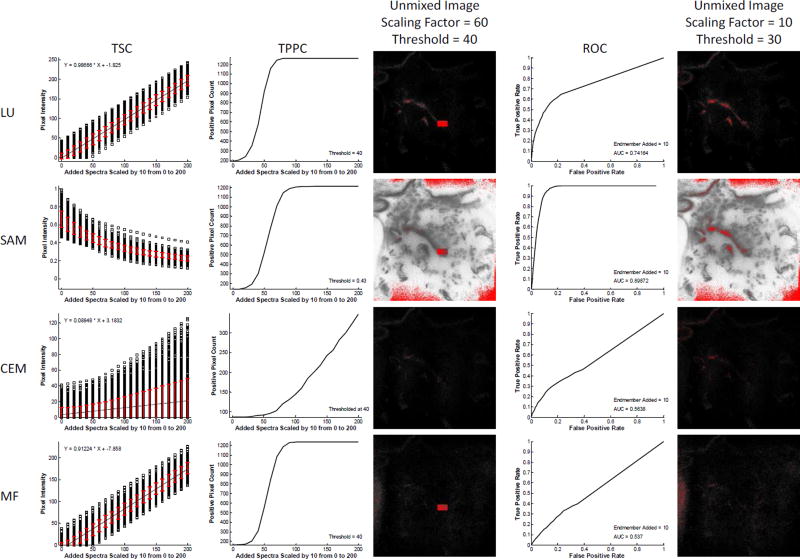
Figure 4.
The theoretical sensitivity analysis methodology can be used to compare the performance of different spectral analysis algorithms for endmember detection, and to select an optimal algorithm. The raw spectral image, region of interest (ROI), and spectral library from Figure 1 were evaluated with 4 analysis algorithms: Linear Unmixing (LU), Spectral Angle Mapper (SAM), Constrained Energy Minimization (CEM), and Matched Filter (MF). For each analysis algorithm, the Theoretical Sensitivity Curve (TSC), Thresholded Positive Pixel Curve (TPPC), and Receiver Operator Characteristic Curve (ROC) were calculated. To generate comparable results for the TPPC, a threshold for each analysis algorithm was selected that resulted in approximately 100–200 false-positive pixels detected (shown as the value of the TPPC at 0 added endmember spectra). Results from the TPPC curve show that LU, SAM, and MF algorithms provide similar response functions for detecting positive pixels. These results can be visualized in the spectrally analyzed target endmember image, generated at a scaling factor of 60 and identical threshold value (pixels above the threshold are false-colored red). Consistent with the TPPC results, a large percentage of pixels within the target region were identified as positive for the LU, SAM, and MF algorithms, but not for CEM. Note that the threshold value for SAM was 0.43 radians. Results from the ROC curve show that SAM provided the best ROC response, as measured by area under the ROC curve (AUC = 0.899), followed by LU (0.742), then CEM (0.564), then MF (0.537). These results were also visualized in the spectrally analyzed target endmember image, generated at a scaling factor of 10 and a threshold value of 30 (a threshold of 0.5 radians was used for the SAM algorithm). As can be seen for this very low level of target endmember added, SAM and LU were the only algorithms that identified even a subset of pixels within the region.

