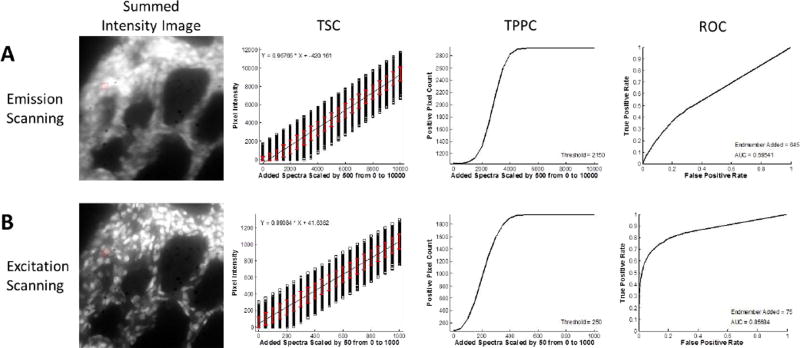
Figure 5.
Theoretical Sensitivity Curve analysis can be used to compare the performance of different spectral imaging hardware or systems. Here, two different microscope configurations were compared: one which used a thin film tunable filter to scan the fluorescence emission spectrum[97, 104] and one which used a similar thin film tunable filter to scan the excitation spectrum[67]. A sample similar to that used in Figure 1 was used and the ability to detect green fluorescent protein (GFP) was assessed. A) The emission-scanning image was acquired using 1 s acquisition time per wavelength band. B) The excitation-scanning image was acquired using 200 ms acquisition time per wavelength band. By visual inspection of the wavelength-summed image data alone, it is clear that the excitation scanning system provides enhanced performance. This is likely due to the fact that the excitation scanning system has fewer optical elements to filter the emitted fluorescence, and thus allows a higher percent transmission of emitted fluorescence and corresponding higher detection sensitivity. Results from a theoretical sensitivity analysis methodology provide a quantitative metric for measuring the enhancement in performance – specifically the reduced false positive rate and the enhanced receiver operator characteristic performance. The theoretical sensitivity curve (TSC) and additional curves were calculated using a non-negatively constrained linear unmixing algorithm. The threshold for the thresholded positive pixel curve (TPPC) and the intensity of endmember added for the Receiver Operator Characteristic Curve (ROC) were scaled by the ratio of acquisition times to provide comparable results. Comparison of the TSC shows that both imaging modalities provide a linear response for detecting GFP. However, comparison of the TPPC for both images shows that detection of GFP-positive pixels is possible with fewer false positive pixels when using excitation scanning. Comparison of the ROC for both images shows that excitation scanning has a much higher area under the curve (AUC = 0.851) vs. emission scanning (AUC = 0.595).

