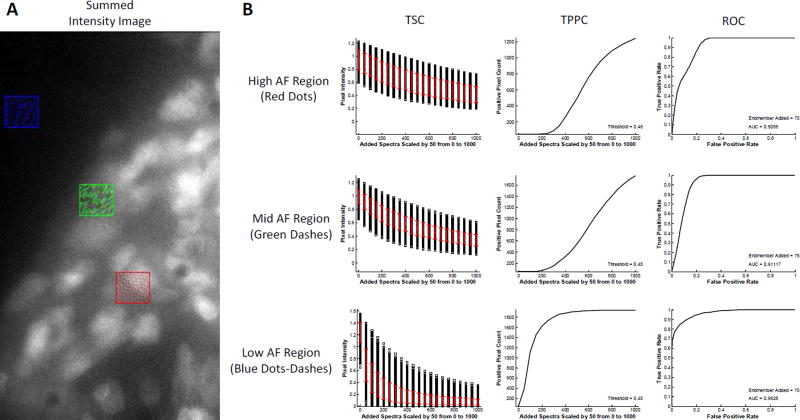
Figure 7.
Comparison of theoretical sensitivity curve analysis performed in 3 regions of interest using spectral angle mapper analysis. A) Regions of interest correspond to high tissue autofluorescence (AF) – indicated by the red region, medium autofluorescence – green region, and low autofluorescence – blue region. In each case the endmember signal for GFP was added incrementally to each pixel in the region. B) Results from the theoretical sensitivity analysis show that incremental additions of GFP signal produce a non-linear and decreasing response for all regions, shown by the Theoretical Sensitivity Curve (TSC). The standard deviation for detecting GFP signal shows no immediate correlation to the level of AF in each region, as shown by the red error bars. Similar to linear unmixing analysis (Figure 6), the slope of the Thresholded Positive Pixel Curve (TPPC) becomes more vertical with decreasing AF, indicating that it is easier to discriminate between positive and negative pixels when AF is low. For the high AF region, the maximum value of the TPPC is 1243 and the minimum is 47, giving a range of 1196 positive pixels. For the mid AF region, the maximum value is 1768 and the minimum is 47, giving a range of 1721 positive pixels. For the low AF region, the maximum value is 1937 and the minimum is 47, giving a range of 1890 positive pixels, which is equal to the total number of pixels within the region (45×42 pixel region). Also similar to linear unmixing analysis, the Receiver Operator Characteristic Curve (ROC) produced increasing area under the curve (AUC) for decreasing autofluorescence, with AUC = 0.901 for the high AF region, AUC = 0.911 for the mid AF region, and AUC = 0.963 for the high AF region.

