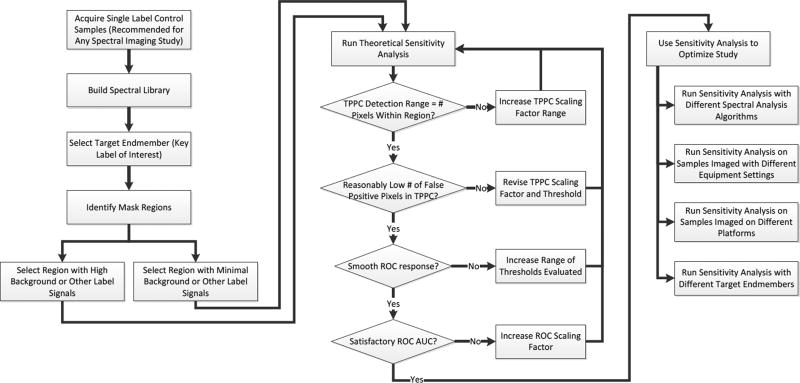
Figure 8.
Flowchart for applying the theoretical sensitivity analysis methodology to optimize a hyperspectral imaging study. The process begins with a simple set of single-label control experiments, from which the spectrum of each label is extracted and stored in a spectral library. A target endmember is then selected and a region within which to evaluate the detection sensitivity is also selected. It is recommended to select 2 regions, one with a low level of other signals (autofluorescence or other labels) and one with the highest level of signals, so as to challenge the detection algorithm. The theoretical sensitivity analysis is then run and the parameters of the analysis adjusted to ensure that an appropriate range of scaling factors and thresholds are evaluated. The results of the sensitivity analysis are then used to select the analysis algorithm, equipment settings, equipment platform, and/or fluorescent labels that maximize detection performance.

