Figure 4.
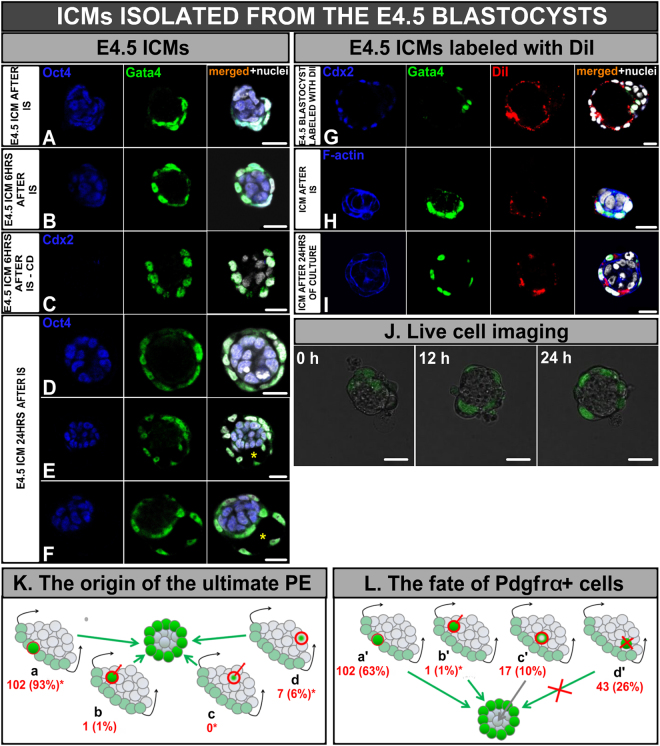
Development of E4.5 ICMs. (A) ICM immediately after IS, and (B) 6 hrs after IS, (C) ICM treated with cytochalasin D (CD) 6 hrs after IS, (D–F) ICMs 24 hrs after IS: (D) surrounded by single layer of PE, (E) containing cavity, (F) surrounded by two layers of PE separated by cavity, (G) E4.5 blastocyst labelled with DiI dye, (H) E4.5 ICMs with DiI-marked PE layer immediately after IS and (I) 24 hrs after IS. Blue: Oct4 or Cdx2 or F-actin, green: Gata4, red: DiI, white: nuclei; right panel shows merged pictures; yellow (*) indicates blastocyst cavity, (J) Time-lapse imaging of E4.5 ICM immediately after isolation, after 12 hrs and after 24 hrs of in vitro culture (single optical sections), (K) The scheme of the ultimate PE origin: (a) Pdgfrα H2B-GFP-expressing cells, which maintained their outside position, (b) Pdgfrα H2B-GFP-expressing cells, which translocated from inside to outside, (c) PdgfrαH2B-GFP-negative cells, which up-regulated Pdgfrα H2B-GFP expression during culture, (d) placed outside PdgfrαH2B-GFP-negative cells, which up-regulated Pdgfrα on the surface of ICM, (L) The scheme of the fate of all Pdgfrα H2B-GFP-expressing cells: (a’) cells which were localised on the surface of ICM, (b’) cells which changed their localisation from inside to outside, (c’) cells which down-regulated Pdgfrα H2B-GFP, (d’) cells which underwent apoptosis. (*) statistically significant difference compared to corresponding cell groups of E3.5 ICMs (p < 0.05). Scale: 20 μm.

