Figure 5.
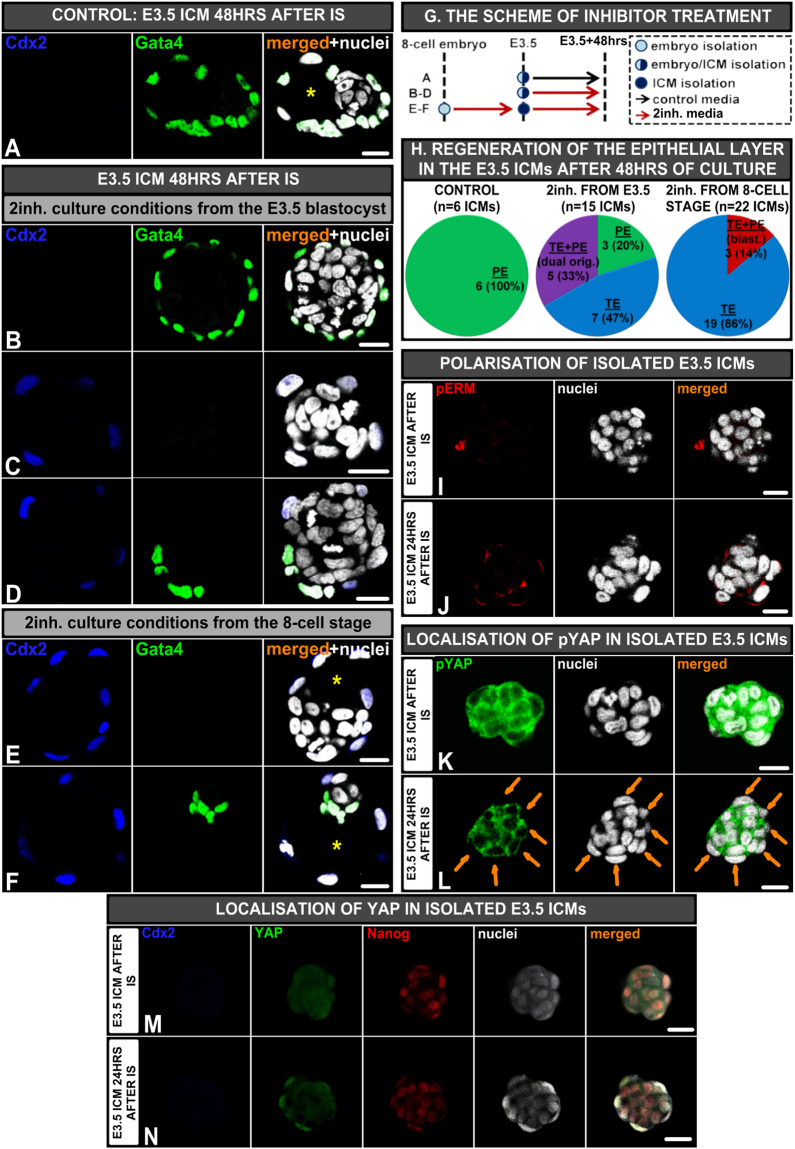
Effect of FGF/MAPK inhibition on isolated E3.5 ICMs. (A) Control E3.5 ICM cultured 48 hrs, (B–D) ICMs derived from E3.5 blastocysts and afterwards cultured 48 hr hrs in 2inh: (B) ICM with the outer PE layer, (C) ICM with the outer TE layer, and (D) ICM with outer heterogeneous (PE and TE) layer, (E,F) ICMs derived from E3.5 blastocysts pre-incubated in 2inh. media from the 8-cell stage: (E) ICM with the outer TE layer, (F) Blastocyst with the TE, EPI and PE, (G) The time schedule of inhibitor treatment; red and black arrows indicate the culture periods in the presence or absence of inhibitors, respectively, (H) Composition of epithelial layer in isolated ICMs cultured 48 hrs, (I,J) Polarisation of E3.5 ICMs (isolated from embryos pre-incubated in 2inh. conditions from the 8-cell stage) immediately (I) and 24 hrs after IS (J), (K,L) Localisation of pYAP in E3.5 ICMs (isolated from embryos pre-incubated in 2inh. conditions from the 8-cell stage) immediately (K) and 24 hrs after IS (L), (M,N) Localisation of nuclear YAP in E3.5 ICMs immediately (M) and 24 hrs after IS (N); yellow (*) indicates blastocyst cavity, orange arrows indicate ICM cells devoid of pYAP signal. Scale: 20 μm.

