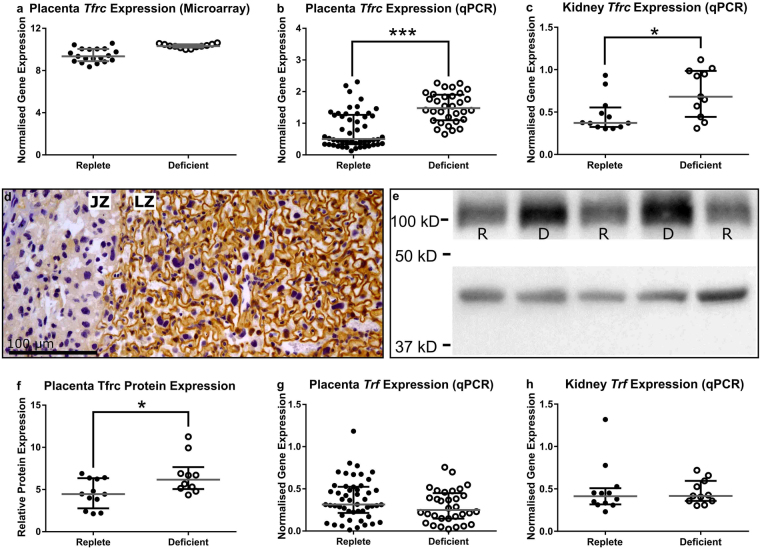
Figure 4.
Microarray analysis revealed an 8.5-fold increase in gene expression of transferrin receptor (Tfrc) in the placentas of the zinc-deficient dams (a). This increase was validated and confirmed in an independent cohort of placental samples using qPCR (b). qPCR was also used to measure Tfrc expression within kidney tissue at GD18.5 and was also increased in tissue collected from zinc-deficient dams (c). Immunohistochemical analysis of Tfrc protein showed localisation to the apical surface of the trophoblast cells within the labyrinth zone (LZ) of the placenta (d). Tfrc protein expression was analysed using Western blot and compared to β-actin expression (e); Tfrc band at ~100 kD and β-actin at ~42 kD, (full image in supplementary information). This revealed an increased expression of Tfrc protein in placentas from zinc-deficient dams (f). Transferrin (Trf) gene expression within the placenta and kidney was also quantified by qPCR but did not differ between the two diet groups (g,h). Data are median and interquartile range (n = 19 and 12 placentas [a]; 50 and 32 placentas [b and g]; 12 and 11 kidneys [c and h] and 12 and 10 placentas [e and f] from 12 zinc-replete and 11 zinc-deficient dams, respectively). Statistical significance was determined using Mann-Whitney Test. *P < 0.05, ***P < 0.001. JZ: junctional zone.

