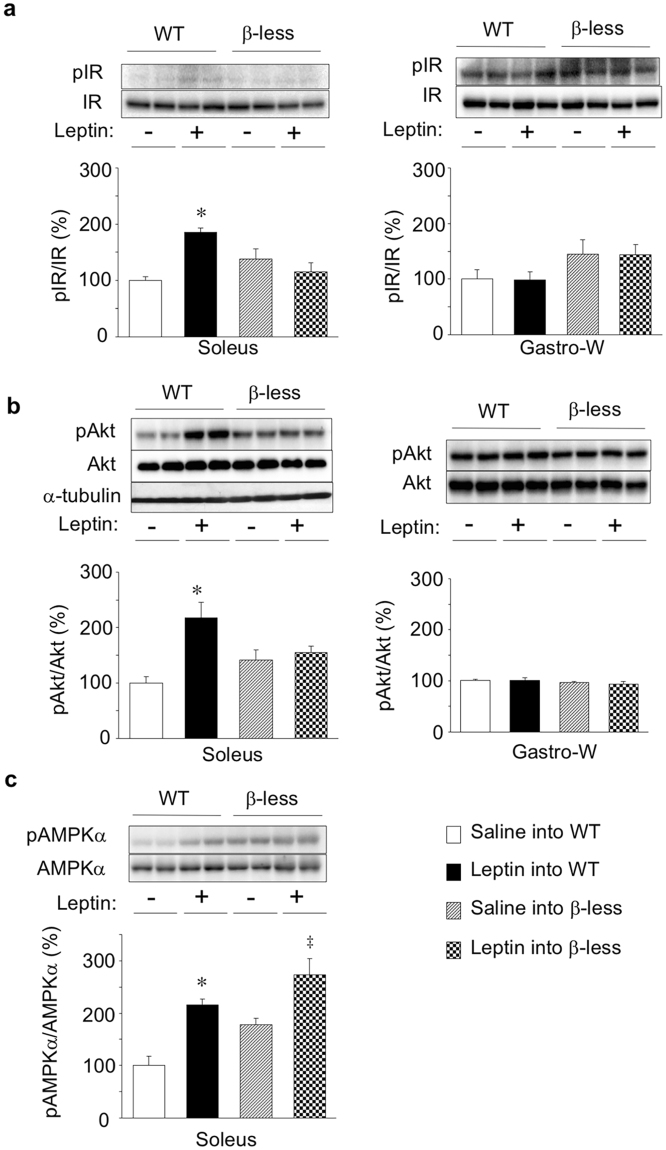
Figure 2.
Effects of leptin on insulin signalling and AMPK activity in soleus muscle of WT and β-less mice. Representative immunoblot analysis of phosphorylated (p) and total forms of IR (a), Akt (b), and the α subunit of AMPK (c) in soleus or Gastro-W at 6 h after injection of saline (−) or leptin (+) into the VMH of WT or β-less mice is shown together with quantitation of the corresponding pIR/IR, pAkt/Akt, and pAMPKα/AMPKα ratios. Representative data were shown in duplicate. Representative immunoblots for α-tubulin were also shown in. (b) Quantitative data are expressed as a percentage of the corresponding value for injection of saline into WT mice and are means ± S.E.M. (n = 4). *P < 0.05 versus corresponding value for saline injection into WT mice; ‡ P < 0.05 versus corresponding value for saline injection into β-less mice (one-way ANOVA and Bonferroni’s multiple-range test).

