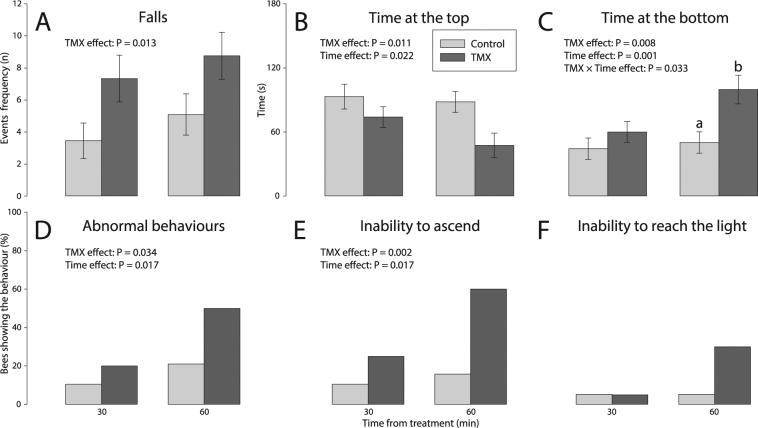
Figure 3.
Sublethal effects of TMX on forager motor functions measured 30 min and 60 min after acute exposure. We show the (A) number of falls per bee, (B) time spent at the arena top, and (C) time spent at the arena bottom (ANOVAREML Repeated Measures, Ncontrol = 19, NTMX = 20). We also plot the frequencies of bees showing (D) abnormal behaviours (see Methods for definitions), (E) inability to ascend the arena, and (F) inability to reach the light (Multiway Frequency, N control = 19, N TMX = 20). The p-values of significant main effects are shown within each plot. Main effects of TMX, time and TMX× time interaction are reported only if significant (see Table 1 for details). Different letters indicate statistically significant differences after post-hoc LS Means contrast tests. Error bars show standard errors.

