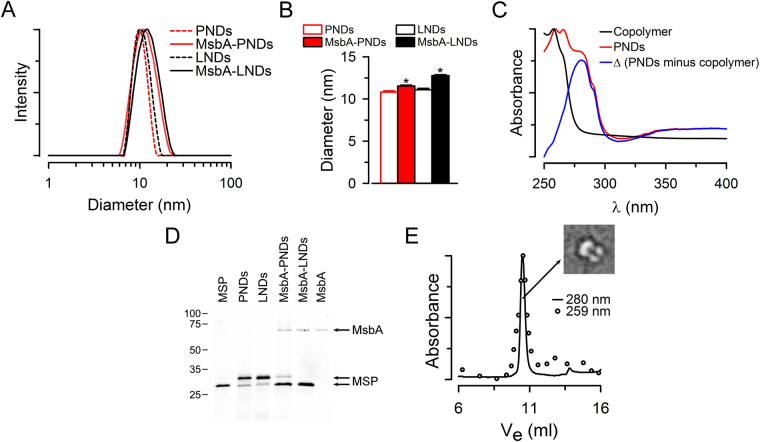
Figure 3.
Characterization of PNDs and their comparison with LNDs. (A) Typical examples illustrating PNDs and LNDs hydrodynamic diameter distributions determined by DLS. (B) Summary of the average hydrodynamic diameter data showing means ± SEM of PNDs (n = 10), MsbA-PNDs (n = 7), LNDs (n = 7) and MsbA-LNDs (n = 7). The asterisks denote P < 0.002 vs. the corresponding MsbA-loaded nanodiscs. (C) Absorption spectra of PNDs and the amphiphilic block copolymer itself in solution. Spectra are normalized to the corresponding peak values. The difference between the spectra is shown in blue. (D) Samples of a representative gel (16% SDS-PAGE) stained with Instant Blue for protein detection. Samples are indicated on top of the lanes. MsbA refers to MsbA T561C and MSP to MSP1E3D1 (equal amounts in moles). The 2 MSP arrows point to MSP1E3D1 with (top) and without (bottom) cleavage of the poly-His tag. MSP in lane 1 and MsbA in lane 6 correspond to purified MSP1E3D1 and MsbA (DDM-solubilized MsbA T561C), respectively. The positions of molecular mass markers (in kDa) are indicated on the left. The lanes are from the same gel, but the MSP, PNDs/LNDs and MsbA-PNDs/MsbA-LNDs/MsbA lanes were not adjacent (original gel presented as Supplementary Fig. 7). (E) Typical SEC of PNDs revealing the co-existence of MsbA and the block copolymer membrane. The sample was run on a PL Aquagel-OH 50 column SEC column (see Materials and Methods for details). The absorbance at 280 nm (line) was used to detect MSP and MsbA tryptophans, and the absorbance at 259 nm (circles) was used to follow the block copolymer membrane. Note that the block copolymer has an absorbance peak at 259 nm due to its pyridine moieties but no absorbance at 280 nm (panel C). Ve: elution volume. Inset: an example of the TEM of MsbA-loaded PND that resembles MsbA in LNDs66 and our PND illustration (Fig. 1A).

