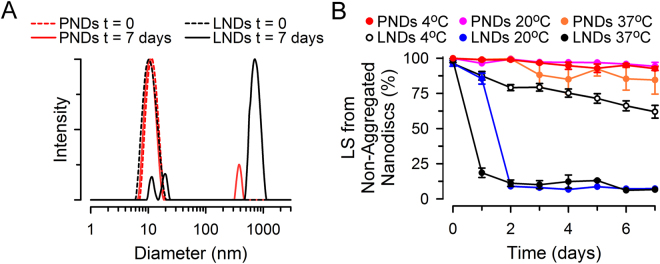
Figure 5.
Stability of PNDs. (A) Typical examples illustrating hydrodynamic diameter distributions determined by DLS of PNDs and LNDs incubated at 37 °C. (B) Aggregation of PNDs and LNDs kept for 1 week at 4 °C, 20 °C or 37 °C, as revealed by DLS. The figure shows the percentage of light scattered (LS) by nanodiscs consisting of a monodisperse population of ~11-nm diameter assessed from size-intensity distributions such as those shown in panel A. See Materials and Methods for details. Data are means ± SEM of 6–7 independent experiments in all conditions, except for PNDs and LNDs at t = 0 (n = 13 and 11, respectively), and PNDs at 20 °C in days 6 and 7, where n = 1 and 2, respectively, and the single measurement and average are reported. SEMs smaller than the symbols are not shown. Differences between PNDs and LNDs were statistically significant (P < 0.001) from day 1 at 37 °C and day 2 onwards at 4 and 20 °C.

