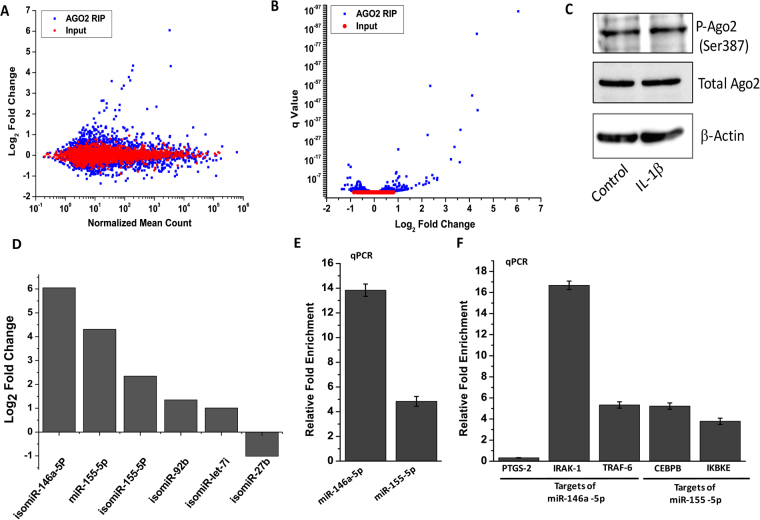
Figure 4.
Characterization of the miRNome differentially associated with the AGO-2 complex in response to IL-1β treatment in primary human chondrocytes. Primary human chondrocytes were left untreated or treated with IL-1β (5 ng/ml) for 16 hrs followed by RNA immunoprecipitation using AGO-2 antibody (AGO2-RIP). The eluted RNA was used for library preparation using small RNA library preparation kit (Illumina) and next generation sequencing on Illumina platform. 10% input RNA was sequenced in parallel. Data were analyzed using Illumina small RNA app available on BaseSpace. (A) M-A plot showing the differential abundance of the miRNAs/isomiRs associated with AGO2 (blue dots) compared to input RNA (red dots). (B) Volcano plot showing the q Value of differentially expressed miRNAs/isomiRs vs Log2 Fold change. (C) Western blot analysis showing the expression and phosphorylation of the AGO2 protein in response to IL-1β. (D) Fold change in the expression of 6 top ranking miRNAs/isomiRs as per the data obtained by NGS. (E) The NGS data shown in D were validated by TaqMan real time PCR using the primers available for canonical sequences only. (F) Enrichment of the selected targets of miR-146a-5p and miR-155-5p in the AGO2 fractions prepared from control cells and IL-1β treated cells was quantified by real time analysis. Data are presented as relative fold enrichment of the selected mRNAs in the AGO2 fraction isolated from IL-1β-treated chondrocytes compared to untreated chondrocytes.

