Fig. 2.
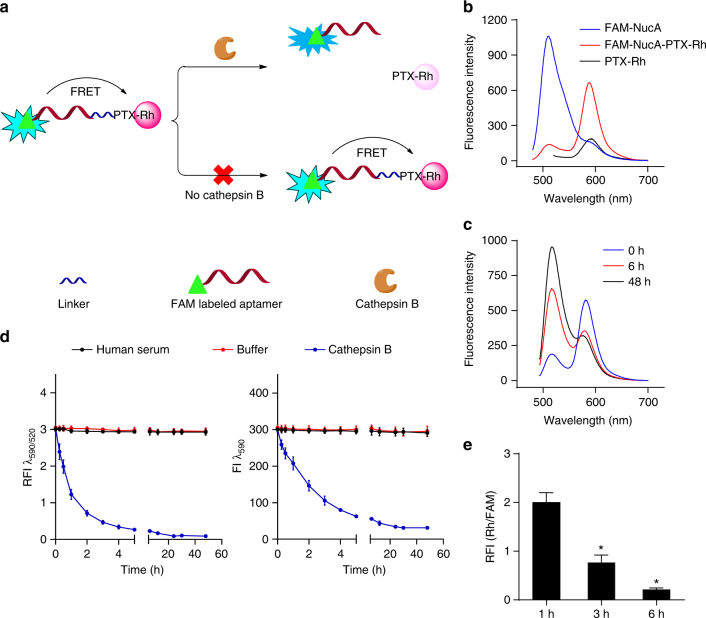
The cathepsin B-dependent release of PTX in FAM-NucA-PTX-Rh. a Schematic diagram of the utilization of FRET in FAM-NucA-PTX-Rh for tracking the rupture of the cathepsin B-labile linker. b Fluorescence emission spectra of FAM-NucA-PTX-Rh, FAM-NucA and PTX-Rh (λex = 470 nm). All compounds were at a concentration of 2 μM. c Fluorescence emission spectra of FAM-NucA-PTX-Rh (λex = 470 nm) in the presence of cathepsin B upon time. FAM-NucA-PTX-Rh and cathepsin B were at a concentration of 2 μM and 0.5 unit mL−1, respectively. d The fluorescence analysis of FAM-NucA-PTX-Rh in human serum and buffer (pH 5.0, containing DTT) without or with cathepsin B upon time. The relative fluorescence intensity of rhodamine to FAM (RFI λ 590/λ 520) indicates the concentration of FAM-NucA-PTX-Rh, and the fluorescence intensity of rhodamine (FI λ 590) indicates the concentration of the conjugated PTX-Rh. FAM-NucA-PTX-Rh and cathepsin B were at a concentration of 2 μM and 0.5 unit mL−1, respectively. Error bars indicate mean ± standard deviation. n = 3. e The intracellular release of PTX-Rh from FAM-NucA-PTX-Rh in SKOV3 cells monitored by flow cytometry. The relative median fluorescence intensity of rhodamine to FAM (RFI Rh/FAM) in SKOV3 cells was examined 1, 3, and 6 h after incubation with 200 nM FAM-NucA-PTX-Rh. Error bars indicate mean ± standard deviation. n = 3, *P < 0.05

