Fig. 4.
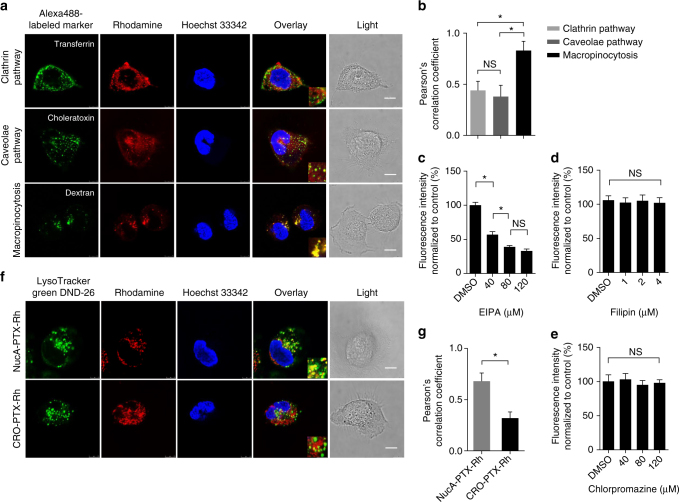
The effect of NucA modification on cellular internalization and trafficking. a Representative images showing the co-localization of the conjugated PTX-Rh (red) in NucA-PTX-Rh with Alexa Fluor 488-labled endocytic markers (transferrin, choleratoxin and dextran; green) by confocal microscopy. The nuclei were counterstained with Hoechst 33,342 (blue). Scale bar, 10 μm. b Pearson’s correlation coefficient analysis of the co-localization between NucA-PTX-Rh and endocytosis markers in SKOV3 cells by Image J Coloc2. Error bars indicate mean ± standard deviation. n = 5 per group. Each replicate is from one biological experiment, quantified with 10 independent fields of view. *P < 0.05; NS: not significant difference. c-e The chemical inhibition of cellular uptake for the conjugated PTX-Rh in CRO-PTX-Rh in SKOV3 cells. The relative fluorescence of rhodamine was quantified after the treatment with inhibitors of three endocytic pathways by flow cytometry: EIPA (macropinocytosis, c), Filipin (caveolae pathway, d), and Chlorpromazine (clathrin pathway, e). Error bars indicate mean ± standard deviation. n = 3. *P < 0.05; NS: not significant difference. f Representative images showing the co-localization of the conjugated PTX-Rh (red) with a lysosomal marker (LysoTracker Green DND-26; green) by confocal microscopy. The nuclei were counterstained with Hoechst 33,342 (blue). Scale bar, 10 μm. g Pearson’s correlation coefficient analysis of the co-localization between the conjugates and lysotracker in SKOV3 cells by Image J Coloc2. The data were presented as the means ± standard deviation. n = 5 per group. Each replicate is from one biological experiment, quantified with 10 independent fields of view. *P < 0.05

