Fig. 7.
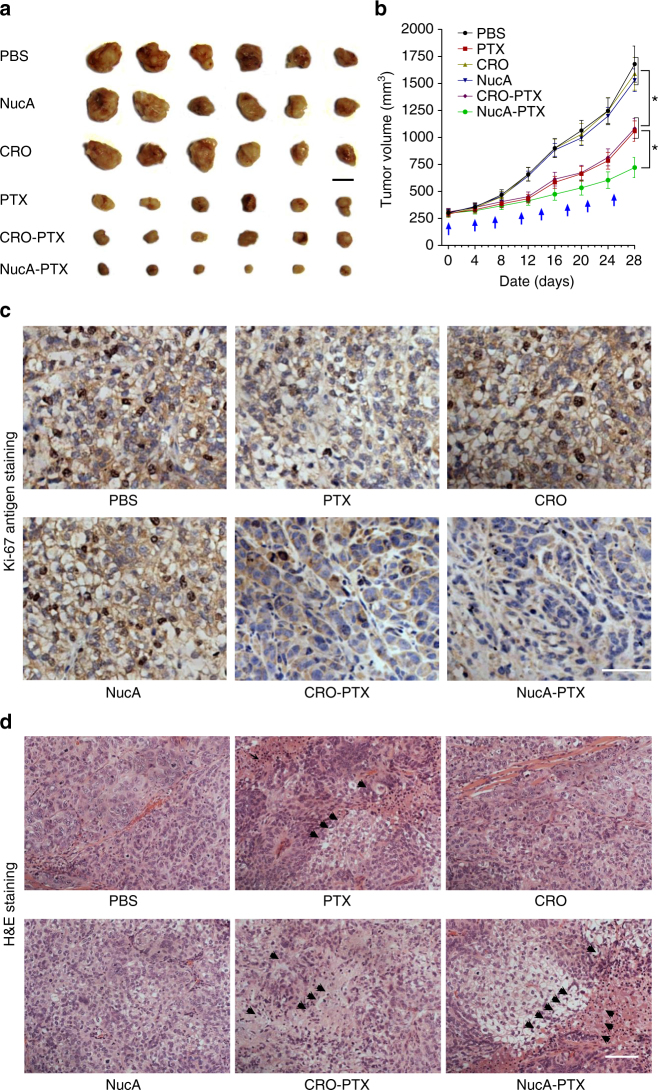
The effect of NucA modification on the antitumor activity of the conjugated PTX. a Macroscopic views of the xenografted tumor after 4 weeks of different treatments from the groups indicated. Scale bar, 1 cm. b Analysis of tumor volume after 4 weeks of different treatments indicated at a dosing frequency of twice a week via intravenous injection. The dosing points were indicated with blue arrows. The data were presented as the means ± standard deviation. n = 6, *P < 0.05. c Ki-67 immunohistochemical staining analysis of ovarian tumor sections from the groups indicated. Ki-67-positive staining was indicated by brown and nuclei were stained by blue. Scale bars, 100 μm. d H&E staining analysis of ovarian tumor sections from each group. Arrows indicate cell apoptosis and necrosis in the tumor sections. Scale bars, 100 μm. Note: PBS, the xenografted mice treated with PBS. PTX, the xenografted mice treated with paclitaxel. CRO, the xenografted mice treated with CRO aptamer. NucA, the xenografted mice treated with nucleolin aptamer. CRO-PTX, the xenografted mice treated with CRO-PTX. NucA-PTX, the xenografted mice treated with NucA-PTX

