Fig. 4.
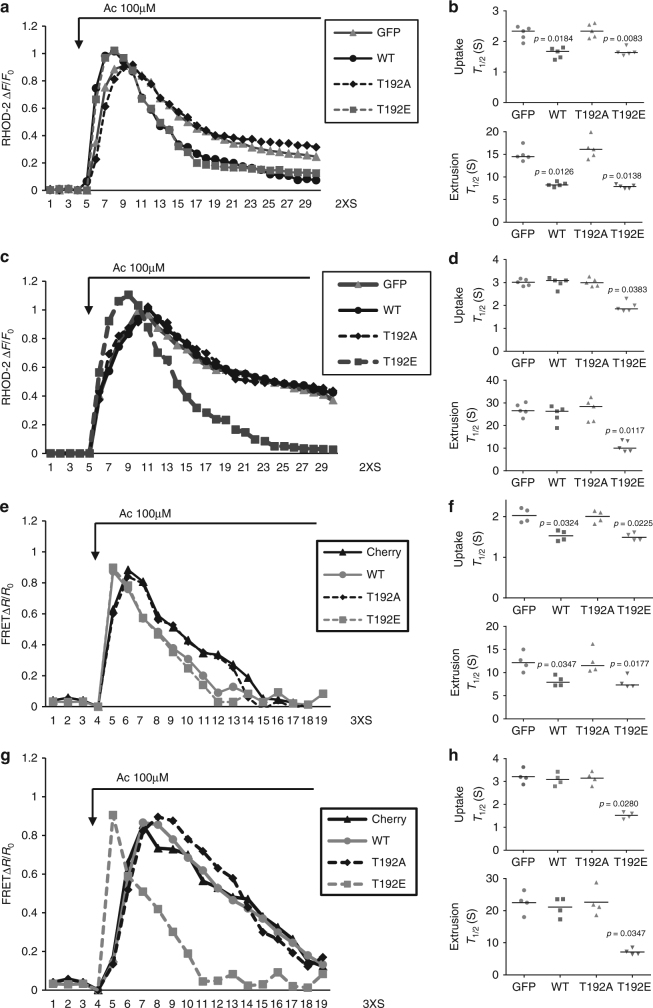
The effect of phospho-LETM1 at Thr192 on mitochondrial calcium transport in primary cortical neurons. a Representative fluorescence traces of mitochondrial Ca2+ imaging in neurons from PINK1 WT infected with adenovirus GFP, LETM1-WT, T192A, and T192E stimulated by Ac. b Quantification of the rate of calcium transport release activity in a measured by T 1/2. n = 5. c Representative fluorescence traces of mitochondrial Ca2+ imaging in neurons from PINK1 KO infected with adenovirus GFP, LETM1-WT, T192A, and T192E stimulated by Ac. d Quantification of the rate of calcium transport release activity in c measured by T 1/2. n = 5. e Representative traces of mitochondrial Ca2+ imaging in neurons infected with lenti-4mTG-TN-XXL from PINK1 WT co-infected with lenti-mitoCherry, LETM1-WT, T192A, and T192E stimulated by Ac. f Quantification of the rate of calcium transport in e measured by T 1/2. n = 4. g Representative traces of mitochondrial Ca2+ imaging in neurons infected with lenti-4mTG-TN-XXL from PINK1 KO co-infected with lenti-mitoCherry, LETM1-3XFLAG-cherry-WT, T192A, and T192E stimulated by Ac. h Quantification of the rate of calcium transport in g measured by T 1/2. n = 4

