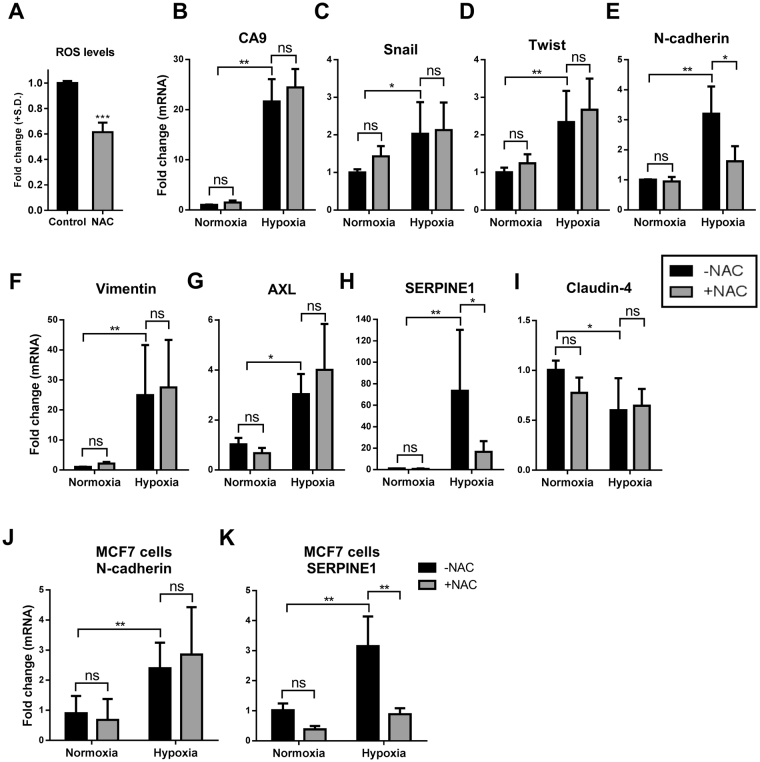
Figure 2.
The effect of NAC treatment on mRNA levels of a panel of genes associated with EMT and hypoxic responses. (A) Intracellular levels of ROS measured by DCF-DA assay in cells exposed to hypoxia (12 h) in the presence and absence of NAC (10 mM). Graph represents the mean ± SD relative to the control (hypoxia with no NAC) for three independent experiments. ***p < 0.0001 (unpaired t-test). Post serum-reduction MDA-MB-468 breast cancer cells were treated with or without NAC (10 mM) and exposed to hypoxia for 24 h. The effect of NAC on (B) CA9, (C) Snail, (D) Twist, (E) N-cadherin, (F) vimentin, (G) AXL, (H) SERPINE1 and claudin-4 (I) was assessed using real time RT-PCR. ns = not significant (p > 0.05), *p < 0.05, **p < 0.01 (two-way ANOVA, with Tukey’s multiple comparisons test). Graphs represent the mean ± SD for three independent experiments. The effect of NAC on the expression of (J) N-cadherin and (K) SERPINE1 in hypoxia and control normoxia was assessed using real time RT-PCR. ns = not significant (p > 0.05), **p < 0.01 (two-way ANOVA, with Tukey’s multiple comparisons test). Graphs represent the mean ± SD for three independent experiments.

