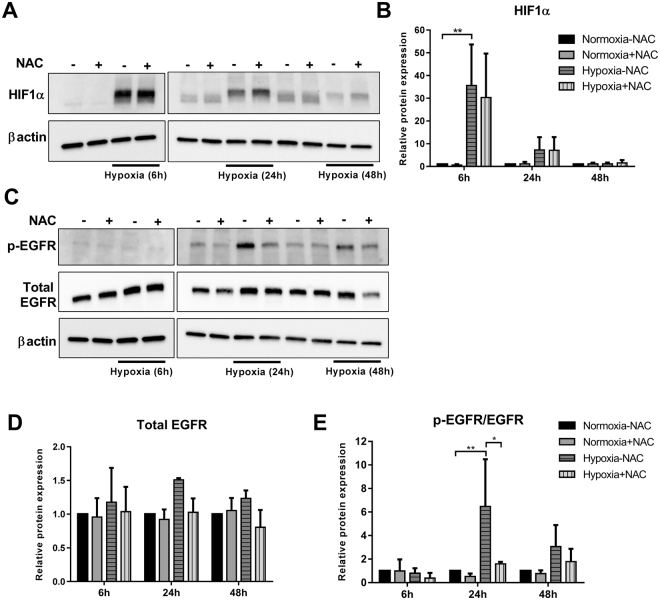
Figure 3.
Effect of NAC on hypoxia-induced HIF1α and EGFR signalling. MDA-MB-468 cells were treated with NAC (10 mM) and exposed to hypoxia for 6 h, 24 h and 48 h. (A) Representative cropped immunoblot and (B) densitometry analysis of HIF1α protein levels (normalised to β-actin). (C) Representative cropped immunoblot and densitometry analysis of (D) total EGFR (normalised to β-actin) and phosphorylated EGFR (p-EGFR) (Y1173) levels (normalised to β-actin and total EGFR) (full-lenght immunoblots are shown in the Supplementary Fig. S2). *p < 0.01, **p < 0.001 (two-way ANOVA, with Tukey’s multiple comparisons test). All densitometry data presented are the mean of three independent experiments ± SD.

