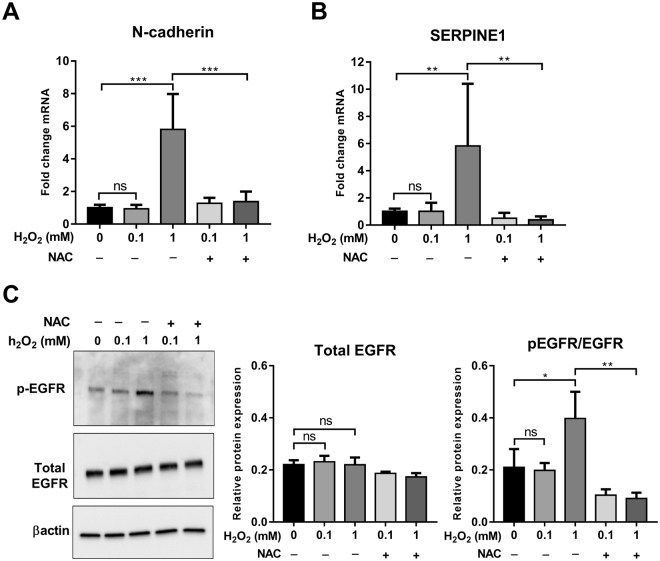
Figure 5.
Effect of H2O2 on the expression of N-cadherin and SERPINE1 and the phosphorylation of EGFR. Post serum reduction (24 h), MDA-MB-468 cells were treated with H2O2 (0.1 and 1 mM) in the presence or absence of NAC (10 mM). The mRNA levels of N-cadherin (A) and SERPINE1 (B) were assessed using real time RT-PCR. (C) Representative cropped immunoblot (left) and densitometry analysis (right) of total EGFR (normalised to β-actin) and pEGFR (normalised to β-actin and total EGFR) (full-lenght immunoblots are shown in the Supplementary Fig. S2). ns = not significant (p > 0.05), *p < 0.05, **p < 0.01, ***p < 0.001 (one-way ANOVA, with Tukey’s multiple comparisons test). Graphs represent the mean ± SD for three independent experiments.

