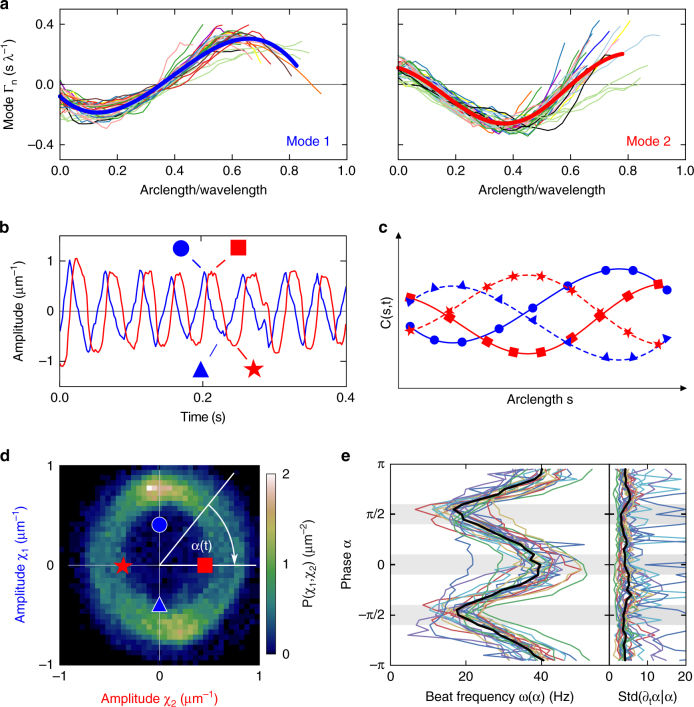
Fig. 2.
Principal-component analysis of the flagellar beat. a Superposition of the two main normal modes of the flagellar beat for n = 35 human sperm cells. Each trace corresponds to a different cell. Although each cell has a different set of eigenmodes, when rescaled by the wavelength λ, the individual modes collapse onto a common curve (solid blue and red lines; see Methods). The wavelength appears longer than the flagellum, because it is traced only partially. b Time evolution of the mode amplitudes χ1 and χ2 for a representative recording. Of note, χ2 lags behind χ1 by a phase of π/2. The symbols (blue circles, red squares, blue triangles, red stars) indicate the modes shown in panel c, and correspond to the beat phase depicted in d. c Illustration of the composition of the beat by principal modes. The peak of the wave travels from left to right. d Histogram of the joint probability P(χ1,χ2), averaged for 1.5 s from 26 different cells. During a full beat cycle, the phase α = arctan(χ2/χ1) varies between 0 and 2π. The symbols indicate the phase of the amplitudes in b. e Beat frequency at a fixed phase for each cell as ω(α) = ⟨∂tα|α⟩. The gray stripes highlight the phases of minimal and maximal frequency (20 Hz and 40 Hz, respectively). The black line indicates the median. The standard deviation of ω(α) is nearly constant (right panel)

