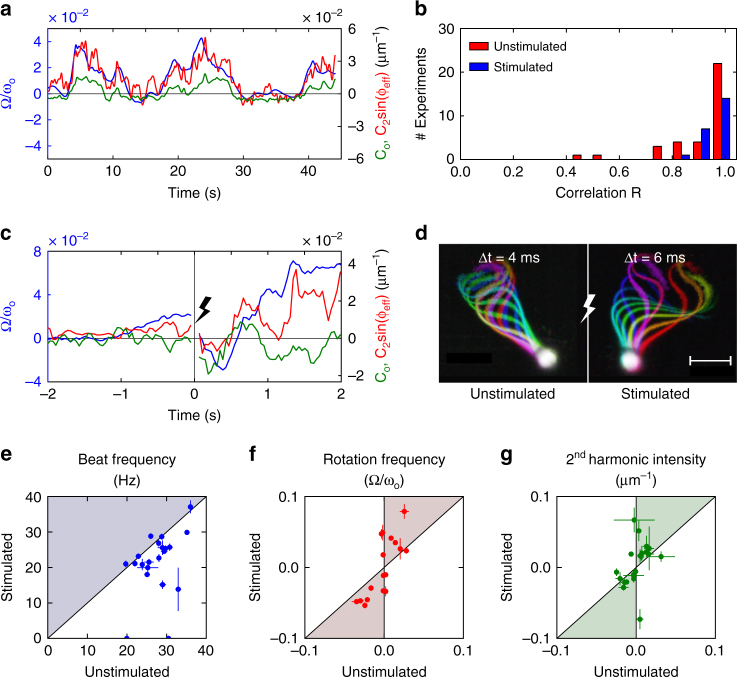
Fig. 3.
Second-harmonic intensity correlates with rotation velocity and is enhanced by progesterone. a Normalized rotation velocity (blue line), second-harmonic intensity (red line), and average curvature (green line) for a representative sperm cell. b Histogram of the correlation R(Ω/ωo, C 2 sin(ϕeff)). Red bars refer to unstimulated human sperm, blue bars to sperm stimulated with progesterone. We never observed anti-correlation (R < 0). c Normalized rotation velocity (blue line) and second-harmonic intensity (red line), and average curvature (green line) 2.0 s before and after the release of progesterone with a flash of UV light (at t = 0). d Stroboscopic views of a sperm cell before (left) and after (right) stimulation with progesterone. Flagellar snapshots were recorded at Δt = 4 ms (left) and Δt = 6 ms (right) intervals. Scale bar represents 10 µm. e–g Cell by cell comparison of the beat frequency (e), the rotation frequency (f), and the second-harmonic intensity (g), before and after progesterone release. Average values during 0.5 s before and after the stimulus. Points inside the colored areas correspond to an increase after the stimulation. Error bars are SD

