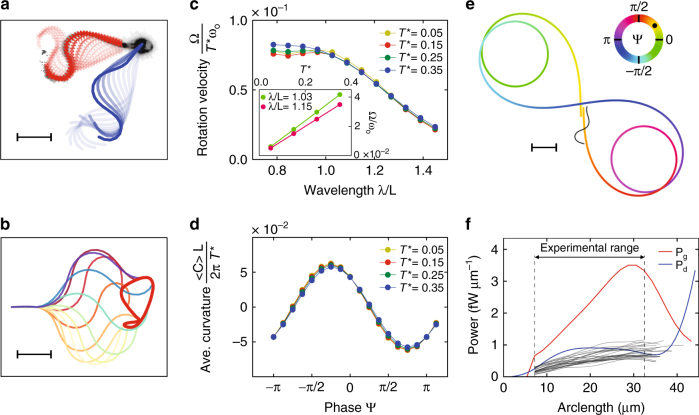
Fig. 4.
Simulations reproduce the beat and steering dynamics. a Stroboscopic view of experimental (red) and simulated (blue) beat pattern using an active semi-flexible filament and anisotropic drag force. Time interval between snapshots (fading lines) is Δt = 2 ms. Simulation parameters: κ = 1.9 nN μm2, T 1 ~ 0.65 nN μm, T 2 = 0.15T 1, ψ = 2.26, ωo = 30 Hz, L = 41 μm, ξ⊥/ξ∥ = 1.81, ξ ∥ = 0.69 fNs μm−2 and λ/L = 0.65 (Supplementary Movie 1). Scale bar represents 10 µm. b Representative simulation of flagellar beat with a second-harmonic amplitude T 2 = 0.3T 1. The mid-piece is aligned for visualization. The time interval between snapshots is Δt = 4 ms. The red thick line shows the non-symmetric trajectory of the flagellum tip. Scale bar represents 10 µm. c Rotation velocity Ω vs. normalized wavelength λ. Note that Ω has been normalized to the second-harmonic torque amplitude. The inset shows that Ω scales linearly with T* = T 2/T 1. d Average curvature < C > vs. phase ψ of the second-harmonic torque. Note that the curvature has been normalized by T* = T 2/T 1. e Simulated sperm trajectory resulting from a slowly changing phase ψ over time (phase indicated by the color of the trajectory). By modulating the phase, sperm swim on curvilinear paths (Supplementary Movie 2). Scale bar represents 20 µm. f Average dissipated power P d (blue) vs. generated power P g (red) in simulations, and average dissipated power measured in experiments (gray lines). The simulated dissipated power shows good agreement with the experimental results. Of note, power is relocated along the flagellum

