
Fig. 1.
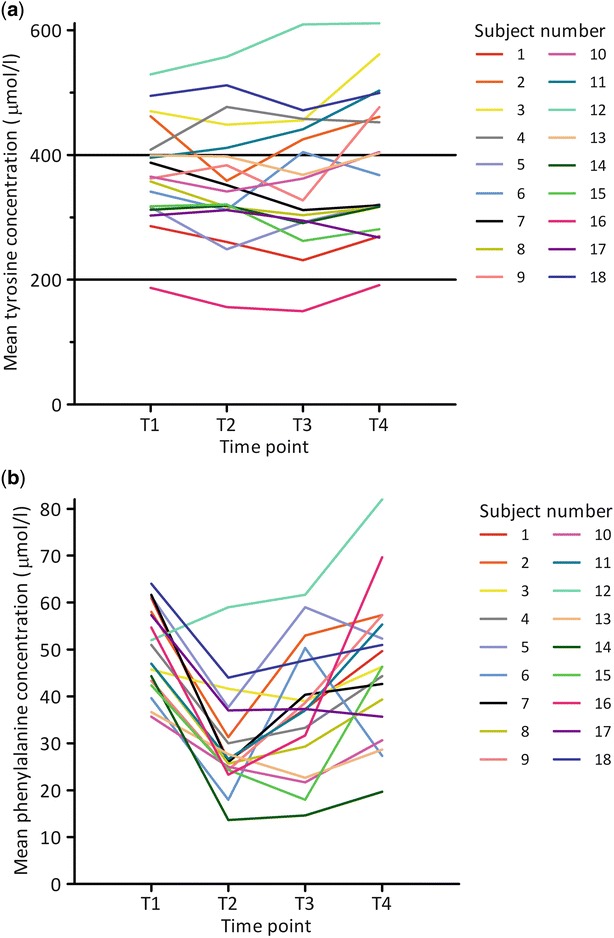
Mean tyrosine concentrations (μmol/L) (a) and mean phenylalanine concentrations (μmol/L) (b) per time point per subject. The black horizontal lines indicate the upper and lower reference value of tyrosine (de Laet et al. 2013). T1 = pre-breakfast, T2 = pre-midday meal, T3 = before evening meal, T4 = bedtime