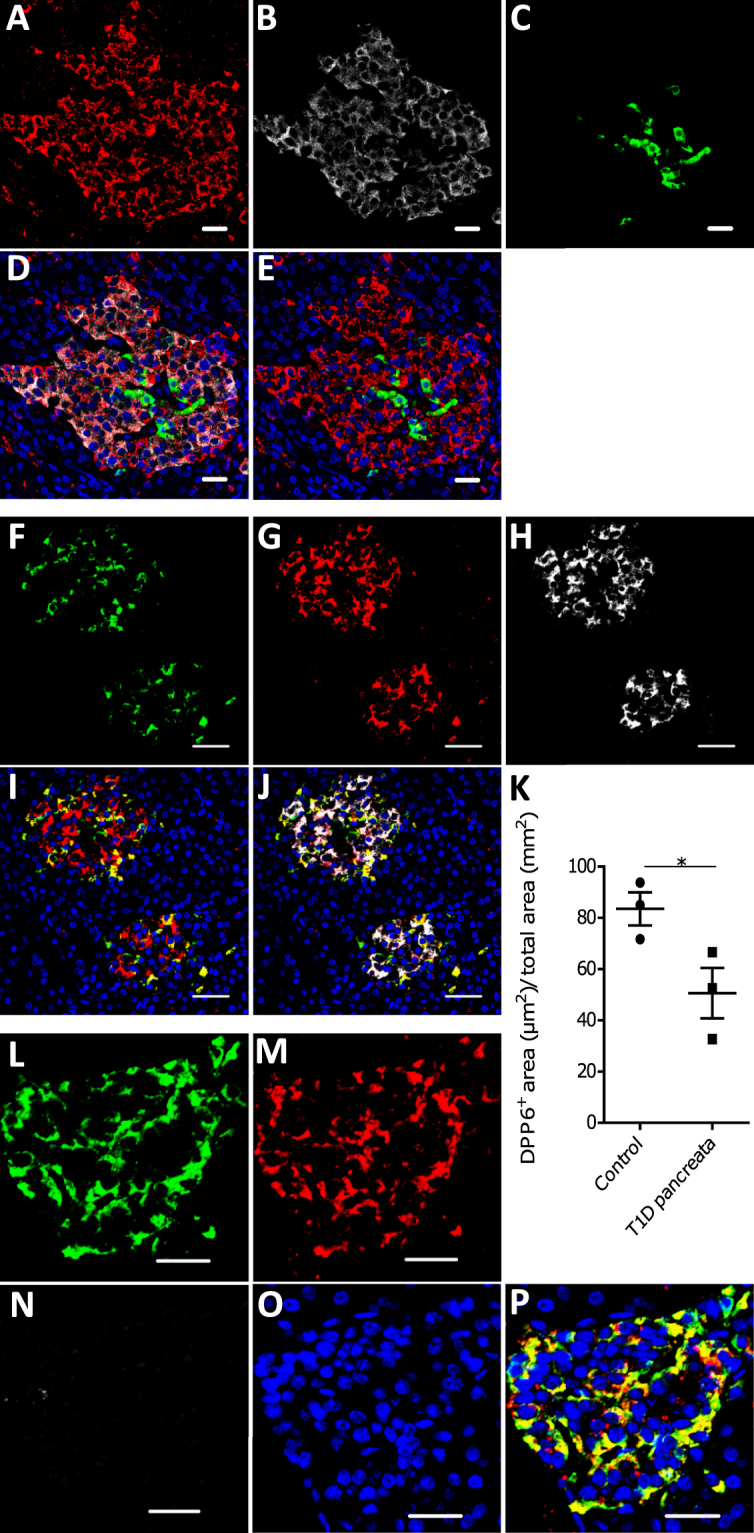
Figure 4.

Localization of DPP6 expression in human pancreas. (A–E) A representative human pancreas stained for DPP6 (A, red), insulin (B, white), somatostatin (C, green); overlay of DPP6 (red), insulin (white) and somatostatin (green) (D); overlay of DPP6 (red) and somatostatin (green) (E); the data indicate co-staining of insulin and DPP6, but not somatostatin and DPP6; (F–J) A representative human pancreas stained for glucagon (F, green), DPP6 (G, red), insulin (H, white); DPP6 (red) and glucagon (green) overlay (I); overlay of DPP6 (red), insulin (white) and glucagon (green) (J), the data indicate co-staining of both insulin and glucagon with DPP6; (K) Morphometric quantification of DPP6 area in pancreata from T1D patients as compared to control, non-diabetic individuals (n = 3). (L–P) A representative human pancreas from a subject with long-term type 1 diabetes (16 years of disease) stained for glucagon (L, green), DPP6 (M, red), insulin (N, white); Hoechst (O, blue); (P) overlay of DPP6 (green), glucagon (red), insulin (white) and Hoechst (blue), indicating that in the absence of insulin positive cells, the remaining glucagon positive cells co-stain for DPP6. In total, 3 pancreata from normoglycemic individuals and 3 from type 1 diabetes subjects were analysed. White scale bar represents 20 µm.
