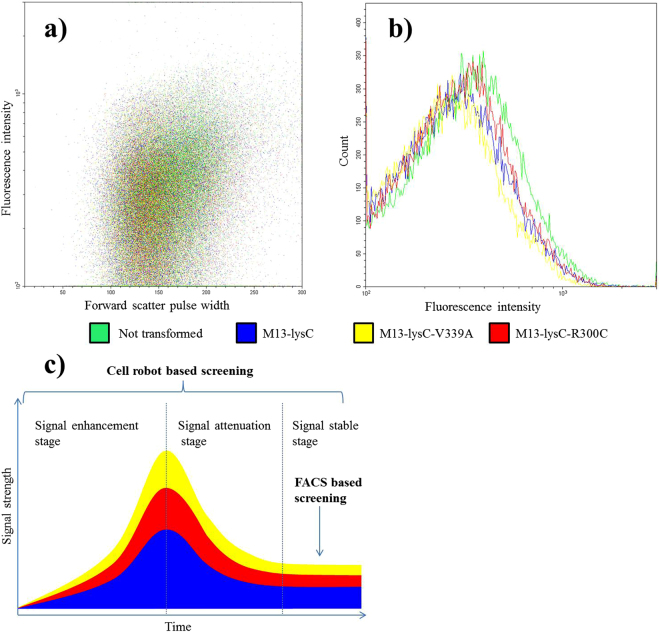
Figure 4.
Flow Cytometry assays of cell populations harboring wild-type AK-III and AK-III muteins. (a) Dot plot of flow cytometry assay results. (b) Statistic analysis of the total cell numbers at different fluorescence intensities. (c) Illustration of differences in signal capture of the cell-robot based and the FACS-based screening methods. Phagemids M13-lysC, M13-lysC-V339A and M13-lysC-R300C were transformed to E. coli XL1-Blue/AP-Lys-B cells individually. Flow Cytometry assays were performed on the obtained cell populations by measuring green fluorescence intensity. Although slight differences could be observed in figure (b), the flow cytometry method failed to distinguish the mutants despite varying the gain setting. Introduction of molecular variants into cells can be regarded as perturbations to the cells. Figure c illustrates possible change of signal after introduction of variants (perturbations): enhancement, attenuation and stabilization.

