Figure 3.
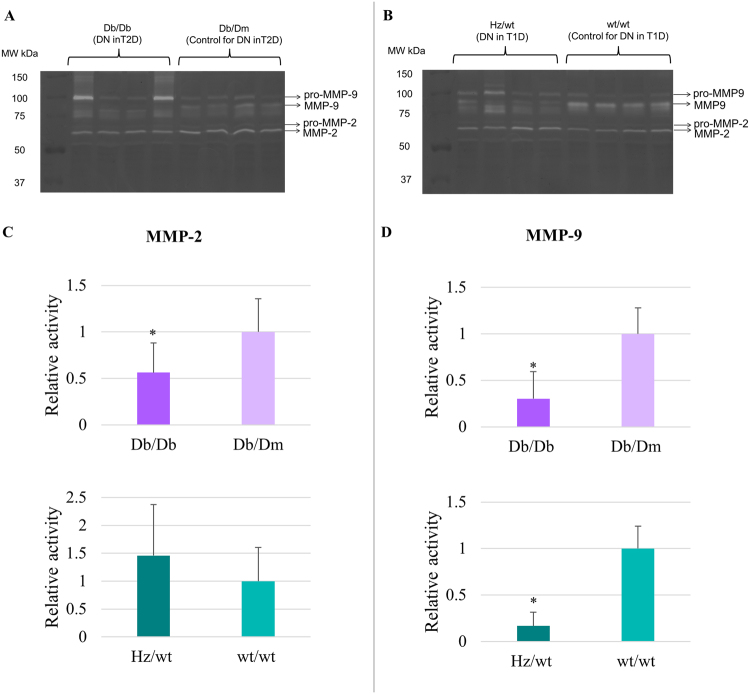
Zymography for the investigation of MMP-2 and MMP-9 activities. (A) Extracts from four biological replicates of DN in type 2 diabetes (T2D; Db/Db) and their respective controls (Db/Dm) were loaded. (B) Extracts from four biological replicates of DN in type 1 diabetes (T1D; Hz/wt) and their respective controls (wt/wt) were loaded. (C) The fold change of MMP-2 activity in DN was assessed relative to the respective controls per category: Db/Db (DN in T2D) was compared to Db/m and Hz/wt (DN in T1D) to wt/wt. The mean value for Db/Db vs. Db/Dm (activity fold change) was 0.56 ± 0.32 (pval < 0.05), whereas the mean value for Hz/wt vs. wt/wt (activity fold change) was 1.46 ± 0.91 (pval > 0.05). (D) The fold change of MMP-9 activity in DN was assessed relative to the appropriate controls for each group. (A) Db/Db (DN in T2D) was compared to Db/m and Hz/wt (DN in T1D) to wt/wt. The mean value for Db/Db vs. Db/Dm (activity fold change) was 0.30 ± 0.29 (pval < 0.05), whereas the mean value for Hz/wt vs. wt/wt (activity fold change) was 0.17 ± 0.15 (pval < 0.05). Graphical representation of densitometry analysis of the results (mean ± SD) is shown (∗pval < 0.05, Student’s t-test).

